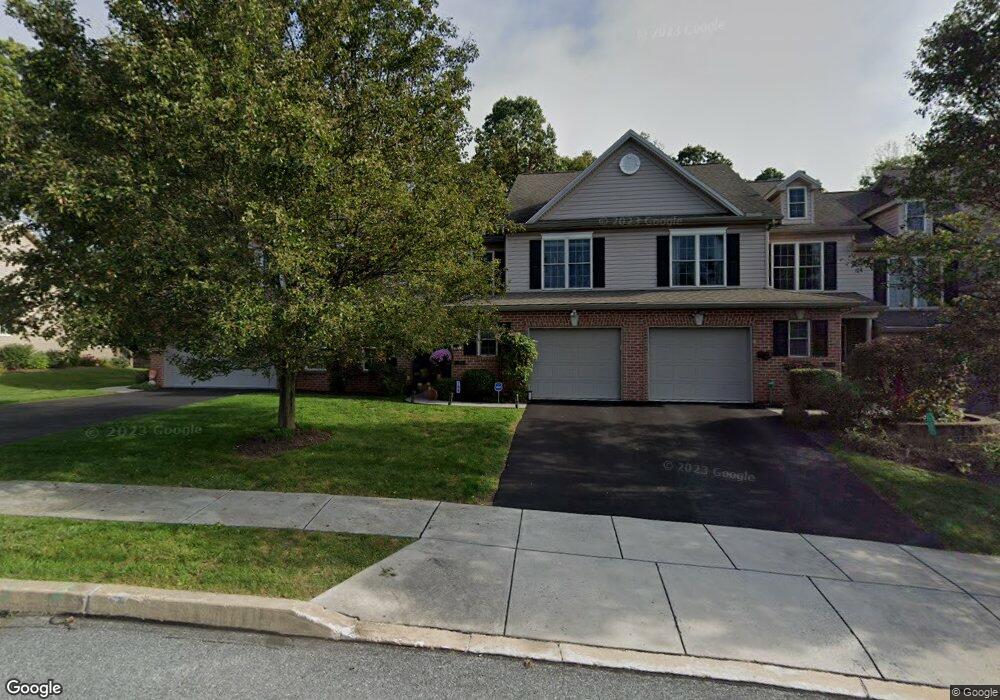
184 Red Haven Rd New Cumberland, PA 17070
Estimated Value: $313,452 - $361,000
3
Beds
2
Baths
2,433
Sq Ft
$140/Sq Ft
Est. Value
About This Home
This home is located at 184 Red Haven Rd, New Cumberland, PA 17070 and is currently estimated at $339,613, approximately $139 per square foot. 184 Red Haven Rd is a home located in York County with nearby schools including Fishing Creek Elementary School, New Cumberland Middle School, and Red Land Senior High School.
Ownership History
Date
Name
Owned For
Owner Type
Purchase Details
Closed on
Jul 15, 2009
Sold by
Endler Michael T and Endler Beth A
Bought by
Cole Diane M
Current Estimated Value
Home Financials for this Owner
Home Financials are based on the most recent Mortgage that was taken out on this home.
Original Mortgage
$211,640
Outstanding Balance
$137,285
Interest Rate
5.19%
Mortgage Type
FHA
Estimated Equity
$202,328
Purchase Details
Closed on
Jul 1, 2005
Sold by
Olde Orchard Hill Development Co Llc
Bought by
Endler Michael T
Home Financials for this Owner
Home Financials are based on the most recent Mortgage that was taken out on this home.
Original Mortgage
$37,820
Interest Rate
5.13%
Mortgage Type
Balloon
Create a Home Valuation Report for This Property
The Home Valuation Report is an in-depth analysis detailing your home's value as well as a comparison with similar homes in the area
Home Values in the Area
Average Home Value in this Area
Purchase History
| Date | Buyer | Sale Price | Title Company |
|---|---|---|---|
| Cole Diane M | $223,000 | None Available | |
| Endler Michael T | $189,107 | First American Title Ins Co |
Source: Public Records
Mortgage History
| Date | Status | Borrower | Loan Amount |
|---|---|---|---|
| Open | Cole Diane M | $211,640 | |
| Previous Owner | Endler Michael T | $37,820 | |
| Previous Owner | Endler Michael T | $151,280 |
Source: Public Records
Tax History Compared to Growth
Tax History
| Year | Tax Paid | Tax Assessment Tax Assessment Total Assessment is a certain percentage of the fair market value that is determined by local assessors to be the total taxable value of land and additions on the property. | Land | Improvement |
|---|---|---|---|---|
| 2025 | $4,161 | $158,920 | $36,010 | $122,910 |
| 2024 | $3,940 | $158,920 | $36,010 | $122,910 |
| 2023 | $3,832 | $158,920 | $36,010 | $122,910 |
| 2022 | $3,820 | $158,920 | $36,010 | $122,910 |
| 2021 | $3,594 | $158,920 | $36,010 | $122,910 |
| 2020 | $3,551 | $158,920 | $36,010 | $122,910 |
| 2019 | $3,489 | $158,920 | $36,010 | $122,910 |
| 2018 | $3,421 | $158,920 | $36,010 | $122,910 |
| 2017 | $3,306 | $158,920 | $36,010 | $122,910 |
| 2016 | $0 | $158,920 | $36,010 | $122,910 |
| 2015 | -- | $158,920 | $36,010 | $122,910 |
| 2014 | -- | $158,920 | $36,010 | $122,910 |
Source: Public Records
Map
Nearby Homes
- Lot 98 Steuben Rd
- 452 Elder Trail
- Lot 101B Elder Trail
- 240 Red Haven Rd
- 494 Old York Rd
- LOT 1 Big Spring Rd
- LOT 2 Big Spring Rd
- 524 Ellencroft Rd
- 603 Bluebill Dr Unit 21B
- 633 Canvasbach Dr Unit 17B
- 604 Bluebill Dr Unit 22D
- 0 Thorley Rd Unit PAYK2090566
- 491 Pine Ridge Cir
- 330 Braddock Dr
- 439 Shuler Rd
- 465 Pleasantview Rd
- 464 Marsh Run Rd
- 313 Lamp Post Ln
- 322 Valley Rd
- 12 Kingswood Dr
- 182 Red Haven Rd
- 186 Red Haven Rd
- 210 Red Haven Rd
- 180 Red Haven Rd
- 178 Red Haven Rd
- 200 Red Haven Rd
- 176 Red Haven Rd
- 204 Red Haven Rd
- 408 Ethan Allen Dr
- 174 Red Haven Rd
- 202 Loring Ct
- 172 Red Haven Rd
- 204 Loring Ct
- 170 Red Haven Rd
- 206 Loring Ct
- 145 Red Haven Rd
- Lot 168 Haven Dr
- 168 Red Haven Rd
- 406 Ethan Allen Dr
- 208 Loring Ct