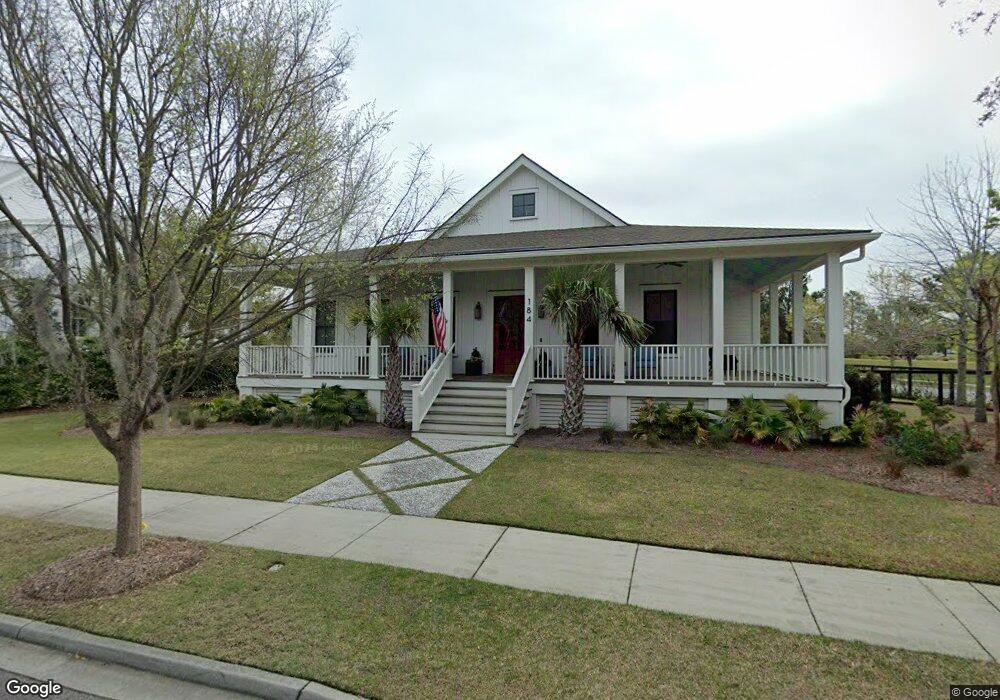
184 Simmons Forge St Charleston, SC 29403
Daniel Island NeighborhoodEstimated Value: $2,097,000 - $2,306,000
3
Beds
4
Baths
2,502
Sq Ft
$880/Sq Ft
Est. Value
About This Home
This home is located at 184 Simmons Forge St, Charleston, SC 29403 and is currently estimated at $2,202,554, approximately $880 per square foot. 184 Simmons Forge St is a home located in Berkeley County with nearby schools including Daniel Island School and Bishop England High School.
Ownership History
Date
Name
Owned For
Owner Type
Purchase Details
Closed on
Sep 27, 2022
Sold by
Patricia D Wallace Revocable Living Trus
Bought by
Cataline Cassandra W
Current Estimated Value
Purchase Details
Closed on
Dec 8, 2016
Sold by
Deford Marion B and Deford Harriett J
Bought by
Wallace Patricia D and Patricia D Wallace Revocable Trust
Purchase Details
Closed on
Jun 4, 2014
Sold by
Spitz Thomas L
Bought by
Deford Marion B and Deford Harriett J
Purchase Details
Closed on
Dec 7, 2012
Sold by
Bennett Hofford Construction Company Inc
Bought by
Spitz Thomas L
Purchase Details
Closed on
Jul 26, 2011
Sold by
Daniel Island Associates Llc
Bought by
Bennett Hofford Construction Company Inc
Create a Home Valuation Report for This Property
The Home Valuation Report is an in-depth analysis detailing your home's value as well as a comparison with similar homes in the area
Home Values in the Area
Average Home Value in this Area
Purchase History
| Date | Buyer | Sale Price | Title Company |
|---|---|---|---|
| Cataline Cassandra W | -- | -- | |
| Wallace Patricia D | $865,000 | -- | |
| Deford Marion B | $811,000 | -- | |
| Spitz Thomas L | $741,250 | -- | |
| Bennett Hofford Construction Company Inc | $200,000 | -- |
Source: Public Records
Tax History Compared to Growth
Tax History
| Year | Tax Paid | Tax Assessment Tax Assessment Total Assessment is a certain percentage of the fair market value that is determined by local assessors to be the total taxable value of land and additions on the property. | Land | Improvement |
|---|---|---|---|---|
| 2025 | $6,471 | $1,005,905 | $455,731 | $550,174 |
| 2024 | $6,534 | $40,236 | $18,229 | $22,007 |
| 2023 | $6,534 | $40,236 | $18,229 | $22,007 |
| 2022 | $17,560 | $34,988 | $12,000 | $22,988 |
| 2021 | $17,617 | $52,480 | $18,000 | $34,482 |
| 2020 | $17,741 | $52,482 | $18,000 | $34,482 |
| 2019 | $17,951 | $52,482 | $18,000 | $34,482 |
| 2018 | $18,439 | $51,972 | $16,560 | $35,412 |
| 2017 | $18,429 | $51,972 | $16,560 | $35,412 |
| 2016 | $16,506 | $46,210 | $12,600 | $33,610 |
| 2015 | $15,766 | $30,800 | $8,400 | $22,400 |
| 2014 | $10,445 | $30,460 | $7,200 | $23,260 |
| 2013 | -- | $30,460 | $7,200 | $23,260 |
Source: Public Records
Map
Nearby Homes
- 141 Ithecaw Creek St
- 351 Lesesne St
- 367 Lesesne St
- 122 Brailsford St
- 572 Wading Place
- 1105 Ship Builder St
- 1124 Ship Builder St
- 1109 Ship Builder St
- 1153 Ship Builder St
- 1149 Ship Builder St
- 1171 Ship Builder St
- 217 Black Powder Ln
- 117 Nobels Point St
- 123 Nobels Point St
- 1077 Ship Builder St
- 250 Island Park Dr Unit 101
- 430 Fish Tale Rd
- 462 Creek Landing St
- 131 Balfour Dr
- 332 Bayley Rd
- 184 Simmons Forge St
- 188 Simmons Forge St
- 310 Lesesne St
- 192 Simmons Forge St
- 180 Ithecaw Creek St
- 205 Amberjack Ln
- 196 Simmons Forge St
- 176 Ithecaw Creek St
- 209 Amberjack Ln
- 320 Lesesne St
- 140 Ithecaw Creek St
- 183 Ithecaw Creek St
- 179 Ithecaw Creek St
- 200 Simmons Forge St
- 210 Amberjack Ln
- 172 Ithecaw Creek St
- 175 Ithecaw Creek St
- 324 Lesesne St
- 217 Amberjack Ln
- 191 Ithecaw Creek St