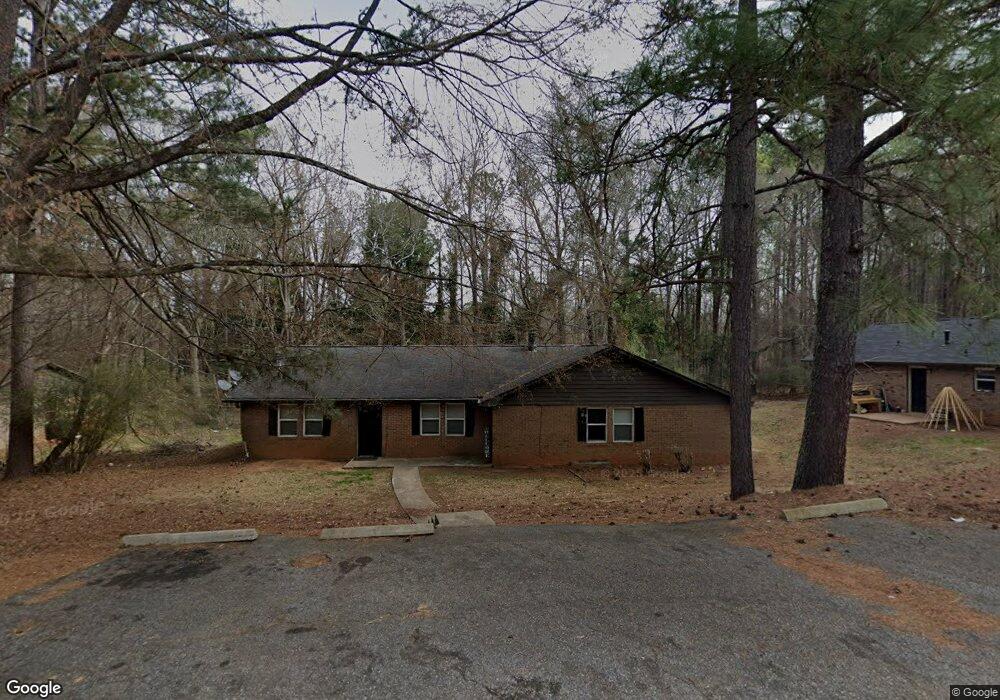
184 Sir Scott Rd Athens, GA 30607
Estimated Value: $170,000 - $215,000
--
Bed
2
Baths
1,848
Sq Ft
$107/Sq Ft
Est. Value
About This Home
This home is located at 184 Sir Scott Rd, Athens, GA 30607 and is currently estimated at $198,394, approximately $107 per square foot. 184 Sir Scott Rd is a home located in Clarke County with nearby schools including Fowler Drive Elementary School, Coile Middle School, and Cedar Shoals High School.
Ownership History
Date
Name
Owned For
Owner Type
Purchase Details
Closed on
Jun 10, 2022
Sold by
Fb Hidden Pines Llc
Bought by
Athens Portfolio 4 Llc
Current Estimated Value
Purchase Details
Closed on
Feb 8, 2019
Sold by
Oar Properties Llc
Bought by
Fb Hidden Pines Llc
Purchase Details
Closed on
Jun 22, 2012
Sold by
Community & Southern Ban
Bought by
Oar Properties Llc
Purchase Details
Closed on
Oct 4, 2011
Sold by
Stonecrab Properties Llc
Bought by
Community & Southern Bank
Purchase Details
Closed on
Apr 30, 2008
Sold by
Faulkner Jeffrey E
Bought by
Stonecrab Properties Llc
Purchase Details
Closed on
May 3, 2005
Sold by
Bar Angus
Bought by
Faulkner Jeffrey E and Faulkner Kimberly W
Purchase Details
Closed on
Jul 12, 1996
Sold by
Faulkner Jeffrey E and Faulkner Kimberly W
Bought by
Bernstein James S
Purchase Details
Closed on
Feb 28, 1995
Sold by
Tidwell Dora and Tidwell Marcus L
Bought by
Faulkner Jeffrey E and Faulkner Kimberly W
Create a Home Valuation Report for This Property
The Home Valuation Report is an in-depth analysis detailing your home's value as well as a comparison with similar homes in the area
Home Values in the Area
Average Home Value in this Area
Purchase History
| Date | Buyer | Sale Price | Title Company |
|---|---|---|---|
| Athens Portfolio 4 Llc | $44,590,000 | -- | |
| Fb Hidden Pines Llc | $11,170,000 | -- | |
| Oar Properties Llc | $642,000 | -- | |
| Community & Southern Bank | $31,900 | -- | |
| Stonecrab Properties Llc | -- | -- | |
| Faulkner Jeffrey E | -- | -- | |
| Bernstein James S | $53,000 | -- | |
| Faulkner Jeffrey E | $51,000 | -- |
Source: Public Records
Tax History Compared to Growth
Tax History
| Year | Tax Paid | Tax Assessment Tax Assessment Total Assessment is a certain percentage of the fair market value that is determined by local assessors to be the total taxable value of land and additions on the property. | Land | Improvement |
|---|---|---|---|---|
| 2025 | $2,080 | $66,985 | $10,400 | $56,585 |
| 2024 | $2,080 | $66,985 | $10,400 | $56,585 |
| 2023 | $2,093 | $66,985 | $10,400 | $56,585 |
| 2022 | $1,425 | $44,680 | $8,000 | $36,680 |
| 2021 | $1,740 | $51,628 | $8,000 | $43,628 |
| 2020 | $1,461 | $43,365 | $8,000 | $35,365 |
| 2019 | $1,466 | $43,178 | $8,000 | $35,178 |
| 2018 | $831 | $24,475 | $6,400 | $18,075 |
| 2017 | $756 | $22,268 | $6,400 | $15,868 |
| 2016 | $725 | $21,342 | $6,400 | $14,942 |
| 2015 | $728 | $21,423 | $6,400 | $15,023 |
| 2014 | $443 | $13,000 | $6,400 | $6,600 |
Source: Public Records
Map
Nearby Homes
- 0 Old Commerce Rd Unit 10617666
- 140 Loblolly Dr
- 145 Noketchee Dr
- 156 Connally Cir
- 32 Pine Lane Dr
- 170 Rocky Dr
- 192 Sunny Hills Dr
- 155 Ashmore Dr
- 110 Connelly Cir
- 495 Boley Dr
- 6006 Smokey
- 2850 Commerce Rd
- 136 Bridgewater Cir
- 2146 Danielsville Rd
- 224 Vineyard Dr
- 425 Bob Holman Rd
- 1266 Towne Square Ct
- 1460 Towne Square Terrace
- 174 Sir Scott Rd
- 188 Sir Scott Rd
- 166 Sir Scott Rd
- 164 Sir Scott Rd
- 335 N Bluff Rd
- 0 Sir Scott Rd Unit 7337100
- 0 Sir Scott Rd
- 194 Sir Scott Rd
- 345 N Bluff Rd
- 325 N Bluff Rd
- 183 Sir Scott Rd
- 177 Sir Scott Rd
- 187 Sir Scott Rd
- 154 Sir Scott Rd
- 355 N Bluff Rd
- 167 Sir Scott Rd
- 197 Sir Scott Rd
- 405 N Bluff Rd Unit 407
- 405 N Bluff Rd
- 195 Sir Scott Rd