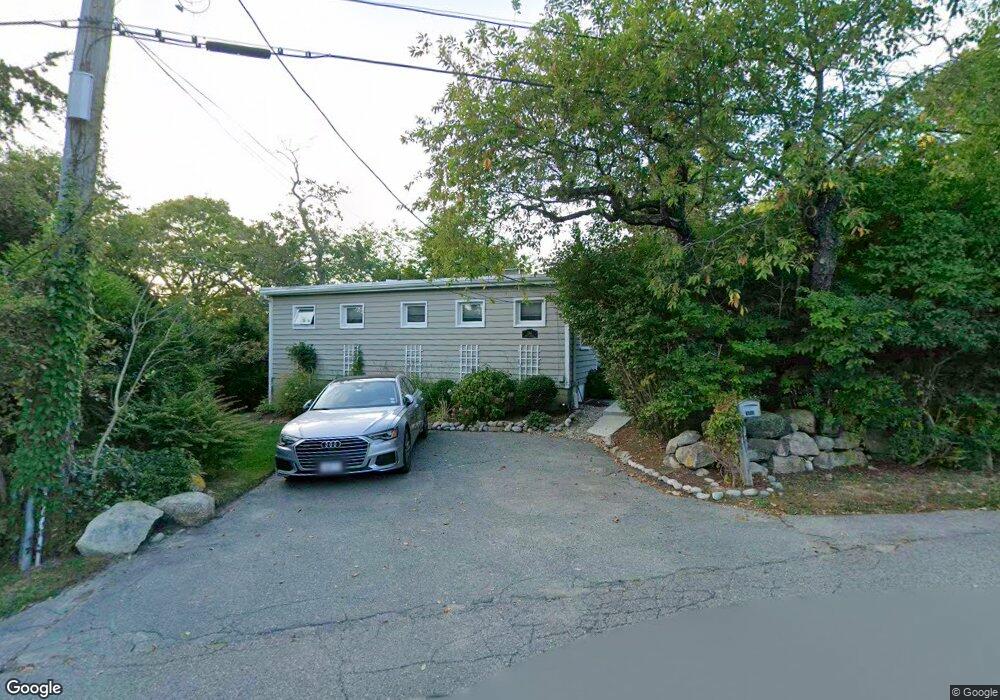
184 South St Rockport, MA 01966
Estimated Value: $529,000 - $767,000
3
Beds
2
Baths
1,169
Sq Ft
$567/Sq Ft
Est. Value
About This Home
This home is located at 184 South St, Rockport, MA 01966 and is currently estimated at $663,067, approximately $567 per square foot. 184 South St is a home located in Essex County with nearby schools including Rockport Elementary School, Rockport Middle School, and Rockport High School.
Ownership History
Date
Name
Owned For
Owner Type
Purchase Details
Closed on
Nov 18, 2005
Sold by
Battle Roberta R
Bought by
Healy Diane E
Current Estimated Value
Home Financials for this Owner
Home Financials are based on the most recent Mortgage that was taken out on this home.
Original Mortgage
$310,000
Outstanding Balance
$176,634
Interest Rate
6.7%
Mortgage Type
Adjustable Rate Mortgage/ARM
Estimated Equity
$486,433
Purchase Details
Closed on
Feb 7, 2000
Sold by
Bates Marjory L and Bates Jacqueline L
Bought by
Fossa Joyce P
Create a Home Valuation Report for This Property
The Home Valuation Report is an in-depth analysis detailing your home's value as well as a comparison with similar homes in the area
Home Values in the Area
Average Home Value in this Area
Purchase History
| Date | Buyer | Sale Price | Title Company |
|---|---|---|---|
| Healy Diane E | -- | -- | |
| Fossa Joyce P | $75,000 | -- | |
| Fossa Joyce P | $75,000 | -- |
Source: Public Records
Mortgage History
| Date | Status | Borrower | Loan Amount |
|---|---|---|---|
| Open | Fossa Joyce P | $90,000 | |
| Open | Fossa Joyce P | $310,000 | |
| Closed | Fossa Joyce P | $310,000 |
Source: Public Records
Tax History Compared to Growth
Tax History
| Year | Tax Paid | Tax Assessment Tax Assessment Total Assessment is a certain percentage of the fair market value that is determined by local assessors to be the total taxable value of land and additions on the property. | Land | Improvement |
|---|---|---|---|---|
| 2025 | $5,346 | $610,300 | $0 | $610,300 |
| 2024 | $4,985 | $592,100 | $0 | $592,100 |
| 2023 | $5,326 | $564,800 | $0 | $564,800 |
| 2022 | $5,261 | $535,700 | $0 | $535,700 |
| 2021 | $5,173 | $531,100 | $0 | $531,100 |
| 2020 | $5,043 | $499,300 | $0 | $499,300 |
| 2019 | $4,923 | $499,300 | $0 | $499,300 |
| 2018 | $4,396 | $434,800 | $0 | $434,800 |
| 2017 | $4,671 | $414,100 | $0 | $414,100 |
| 2016 | $4,452 | $395,700 | $0 | $395,700 |
| 2015 | $4,301 | $391,000 | $0 | $391,000 |
| 2014 | $4,278 | $379,600 | $0 | $379,600 |
Source: Public Records
Map
Nearby Homes
- 48 Eden Rd
- 1 Arens Rd
- 29 Summer St
- 12 Seagull St
- 4 Alpaca Ct
- 6 Prospect St
- 34 Mount Pleasant St
- 57 Mt Pleasant St Unit 2B
- 13 Pleasant St Unit 3
- 5 Marshall Ln
- 4 Norwood Ave
- 15 High St Unit D
- 5 Allen Ave
- 2 Mount Pleasant St Unit 3
- 135 A&B Main St
- 36 Broadway Ave
- 123 Main St Unit 2
- 73-77 Main St
- 63R Main St Unit 2
- 10 Old Nugent Farm Rd
- 184 South St Unit 184R
- 184 South St Unit 352
- 184 South St Unit 252
- 184 South St Unit A
- 186 South St
- 182 South St
- 188 South St
- 1 Heritage Dr
- 45 Thatcher Rd
- 3 Heritage Dr
- 108 Penzance Rd
- 185 South St
- 346 South St
- 190 South St
- 176 South St
- 193 South St
- 115 Penzance Rd
- 192 South St Unit 2
- 5 Heritage Dr
- 192 South St