Estimated Value: $350,000 - $396,000
2
Beds
1
Bath
1,658
Sq Ft
$229/Sq Ft
Est. Value
About This Home
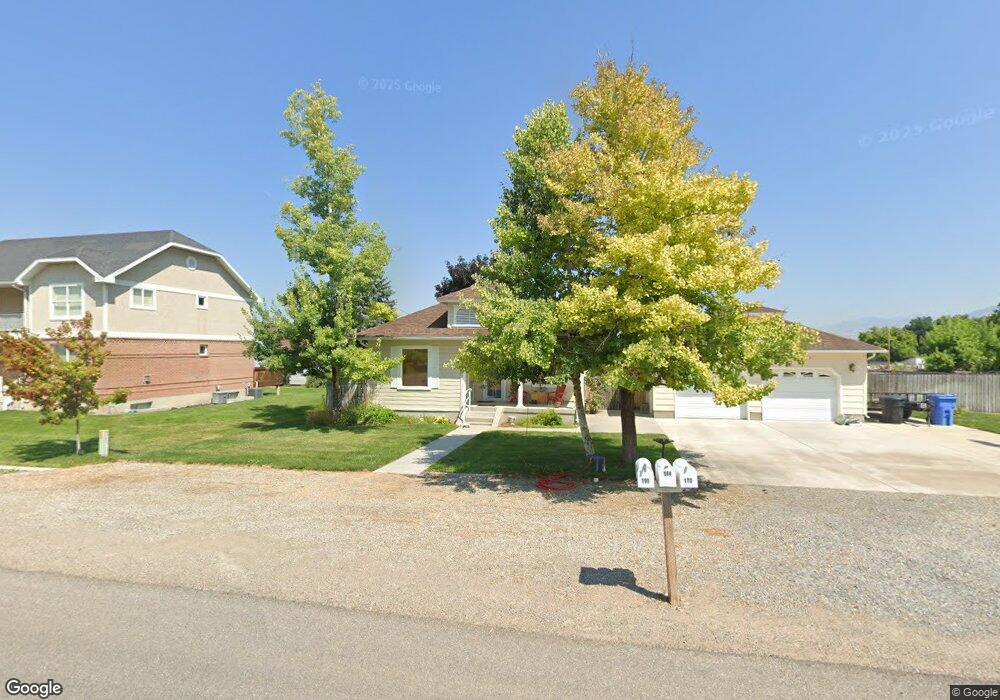
This home is located at 184 W 400 S, Hyrum, UT 84319 and is currently estimated at $380,065, approximately $229 per square foot. 184 W 400 S is a home located in Cache County with nearby schools including Lincoln School, South Cache Middle School, and Mountain Crest High School.
Ownership History
Date
Name
Owned For
Owner Type
Purchase Details
Closed on
Sep 17, 2025
Sold by
Yount Lynn C
Bought by
Lynn Yount Living Trust and Yount
Current Estimated Value
Purchase Details
Closed on
Aug 29, 2020
Sold by
Yount Belinda C and Estate Of Donna C Yount
Bought by
Yount Belinda C and The Donna C Yount Revocable Li
Purchase Details
Closed on
Aug 23, 2020
Sold by
Yount Belinda C and The Donna C Yount Revocable Li
Bought by
Yount Lynn C
Purchase Details
Closed on
Dec 16, 2013
Sold by
Pierce Richard
Bought by
Milne Richard and Milne Sandi L
Purchase Details
Closed on
Sep 10, 2013
Sold by
Rasmussen Danielle
Bought by
Yount Donna Claire
Home Financials for this Owner
Home Financials are based on the most recent Mortgage that was taken out on this home.
Original Mortgage
$113,000
Interest Rate
4.36%
Mortgage Type
New Conventional
Create a Home Valuation Report for This Property
The Home Valuation Report is an in-depth analysis detailing your home's value as well as a comparison with similar homes in the area
Home Values in the Area
Average Home Value in this Area
Purchase History
| Date | Buyer | Sale Price | Title Company |
|---|---|---|---|
| Lynn Yount Living Trust | -- | None Listed On Document | |
| Lynn Yount Living Trust | -- | None Listed On Document | |
| Yount Belinda C | -- | None Available | |
| Yount Lynn C | -- | None Available | |
| Milne Richard | -- | Cache Title Logan | |
| Yount Donna Claire | -- | Cottonwood Title Ins Agency |
Source: Public Records
Mortgage History
| Date | Status | Borrower | Loan Amount |
|---|---|---|---|
| Previous Owner | Yount Donna Claire | $113,000 |
Source: Public Records
Tax History Compared to Growth
Tax History
| Year | Tax Paid | Tax Assessment Tax Assessment Total Assessment is a certain percentage of the fair market value that is determined by local assessors to be the total taxable value of land and additions on the property. | Land | Improvement |
|---|---|---|---|---|
| 2024 | $1,743 | $233,730 | $0 | $0 |
| 2023 | $1,448 | $185,645 | $0 | $0 |
| 2022 | $14 | $177,150 | $0 | $0 |
| 2021 | $1,314 | $248,651 | $65,050 | $183,601 |
| 2020 | $1,161 | $206,282 | $65,050 | $141,232 |
| 2019 | $1,085 | $181,232 | $40,000 | $141,232 |
| 2018 | $1,028 | $166,100 | $40,000 | $126,100 |
| 2017 | $875 | $73,370 | $0 | $0 |
| 2016 | $895 | $73,370 | $0 | $0 |
| 2015 | $897 | $73,370 | $0 | $0 |
| 2014 | $891 | $74,470 | $0 | $0 |
| 2013 | -- | $74,470 | $0 | $0 |
Source: Public Records
Map
Nearby Homes