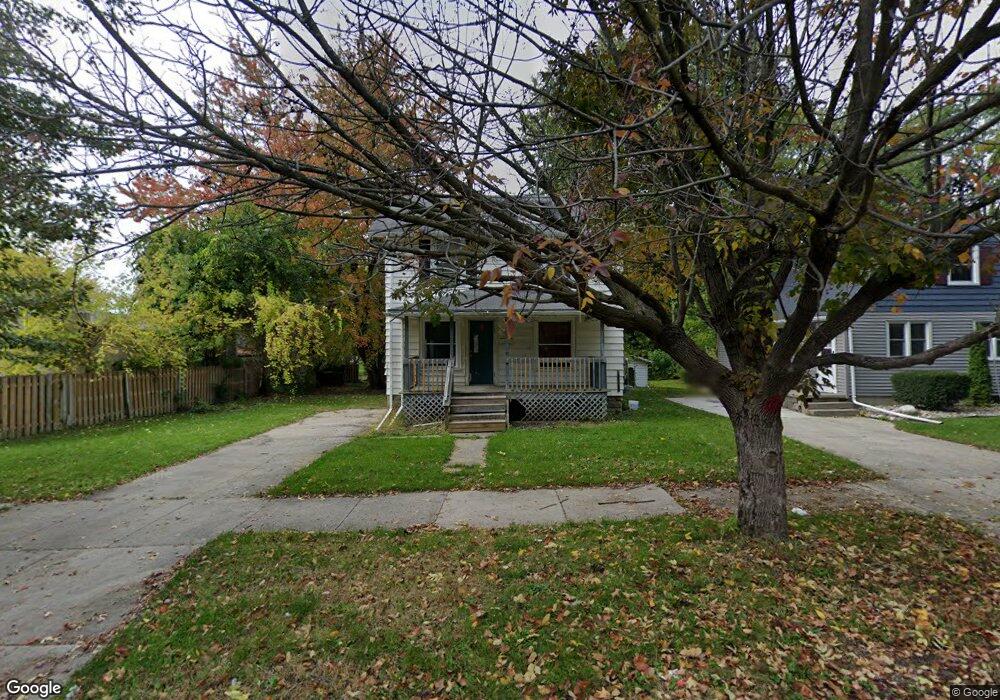
1840 Bradley Ave Lansing, MI 48910
Moores Park NeighborhoodEstimated Value: $82,097 - $142,000
3
Beds
1
Bath
960
Sq Ft
$114/Sq Ft
Est. Value
About This Home
This home is located at 1840 Bradley Ave, Lansing, MI 48910 and is currently estimated at $109,274, approximately $113 per square foot. 1840 Bradley Ave is a home located in Ingham County with nearby schools including Averill Elementary School, Pattengill Academy, and J.W. Sexton High School.
Ownership History
Date
Name
Owned For
Owner Type
Purchase Details
Closed on
Nov 10, 2021
Sold by
Schertzing Eric A
Bought by
Kayani Alizaman
Current Estimated Value
Purchase Details
Closed on
Apr 9, 2018
Sold by
Sial Hussan
Bought by
Kayani Ali Zaman
Purchase Details
Closed on
Sep 29, 2017
Sold by
Schertzing Eric
Bought by
Sial Hussan
Purchase Details
Closed on
Nov 27, 2015
Sold by
Allen Cynthia Ann and Salinas Roberto Abel
Bought by
Allen Cynthia Ann
Purchase Details
Closed on
May 30, 2008
Sold by
Tews Roger K and Tews Kay L
Bought by
Canada Roy and Canada Ruby
Purchase Details
Closed on
May 21, 2007
Sold by
Mortgage Electronic Registration Systems
Bought by
Deutsche Bank National Trust Co and Ixis Real Estate Capital Trust 2005-He1
Purchase Details
Closed on
Apr 26, 2007
Sold by
Canada Roy and Canada Ruby
Bought by
Mortgage Electronic Registration Systems
Create a Home Valuation Report for This Property
The Home Valuation Report is an in-depth analysis detailing your home's value as well as a comparison with similar homes in the area
Home Values in the Area
Average Home Value in this Area
Purchase History
| Date | Buyer | Sale Price | Title Company |
|---|---|---|---|
| Kayani Alizaman | -- | None Available | |
| Kayani Ali Zaman | -- | None Available | |
| Sial Hussan | $17,000 | None Available | |
| Allen Cynthia Ann | -- | None Available | |
| Canada Roy | $58,022 | Itc | |
| Deutsche Bank National Trust Co | -- | None Available | |
| Mortgage Electronic Registration Systems | $65,250 | None Available |
Source: Public Records
Tax History Compared to Growth
Tax History
| Year | Tax Paid | Tax Assessment Tax Assessment Total Assessment is a certain percentage of the fair market value that is determined by local assessors to be the total taxable value of land and additions on the property. | Land | Improvement |
|---|---|---|---|---|
| 2025 | $4,382 | $39,200 | $5,300 | $33,900 |
| 2024 | $33 | $40,100 | $5,300 | $34,800 |
| 2023 | $5,286 | $35,200 | $5,300 | $29,900 |
| 2022 | $2,399 | $33,900 | $7,600 | $26,300 |
| 2021 | $9,862 | $30,400 | $5,500 | $24,900 |
| 2020 | $2,230 | $29,200 | $5,500 | $23,700 |
| 2019 | $2,412 | $26,800 | $5,500 | $21,300 |
| 2018 | $2,451 | $25,400 | $5,500 | $19,900 |
| 2017 | $1,766 | $0 | $0 | $0 |
| 2016 | $3,132 | $24,400 | $5,500 | $18,900 |
| 2015 | $3,132 | $23,400 | $10,905 | $12,495 |
| 2014 | $3,132 | $22,200 | $6,164 | $16,036 |
Source: Public Records
Map
Nearby Homes
- 511 W Mount Hope Ave
- 1836 Osband Ave
- 1723 Osband Ave
- 2011 Osband Ave
- 712 Lenore Ave
- 907 Lenore Ave
- 1913 Stirling Ave
- 1722 S Washington Ave
- 2313 S Rundle Ave
- 917 W Barnes Ave
- 2112 Stirling Ave
- 139 Woodlawn Ave
- 1010 W Barnes Ave
- 815 Woodbine Ave
- 2406 Markley Place
- 202 Woodlawn Ave
- 1927 Teel Ave
- 2001 S Martin Luther King Junior Blvd
- 2011 S Martin Luther King jr Blvd
- 2310 Stirling Ave
- 1834 Bradley Ave
- 500 W Mount Hope Ave
- 1832 Bradley Ave
- 1828 Bradley Ave
- 516 W Mount Hope Ave
- 1824 Bradley Ave
- 1839 Osband Ave
- 1835 Osband Ave
- 1833 Osband Ave
- 1849 Osband Ave
- 1847 Bradley Ave
- 1845 Osband Ave
- 1827 Osband Ave
- 528 W Mount Hope Ave
- 424 W Mount Hope Ave
- 1814 Bradley Ave
- 1839 Bradley Ave
- 0 V L W Mt Hope Pn#095 Ave
- 1837 Bradley Ave