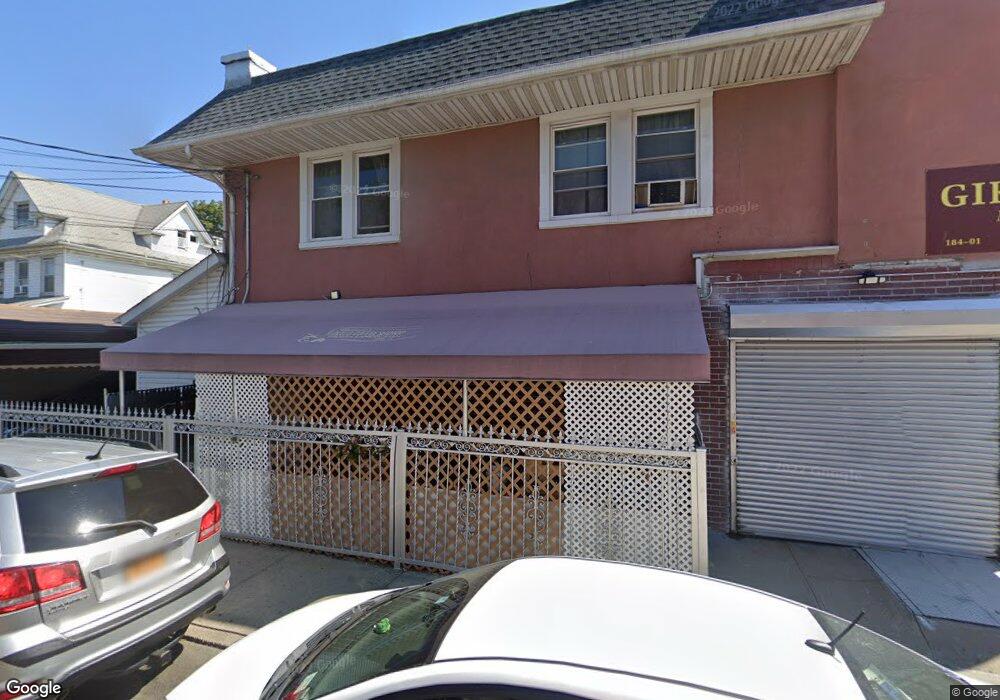
18401 Jamaica Ave Hollis, NY 11423
Hollis NeighborhoodEstimated Value: $629,000
--
Bed
--
Bath
2,880
Sq Ft
$218/Sq Ft
Est. Value
About This Home
This home is located at 18401 Jamaica Ave, Hollis, NY 11423 and is currently priced at $629,000, approximately $218 per square foot. 18401 Jamaica Ave is a home located in Queens County with nearby schools including P.S. 95 - Eastwood, I.S. 238 Susan B Anthony Academy, and Wellspring Elementary & Middle.
Ownership History
Date
Name
Owned For
Owner Type
Purchase Details
Closed on
May 29, 2001
Sold by
Ramlackhan Rohan and Khan Kalama
Bought by
Mallay Phillip and Mallay Mandramatie
Current Estimated Value
Home Financials for this Owner
Home Financials are based on the most recent Mortgage that was taken out on this home.
Original Mortgage
$160,000
Interest Rate
7.18%
Purchase Details
Closed on
Mar 21, 2000
Sold by
Ramlackhan Rohan and Ramlackhan Pamela
Bought by
Ramlackhan Rohan and Khan Kalama
Purchase Details
Closed on
Jun 2, 1995
Sold by
Almonte Gilberto
Bought by
Ramlackhan Rohan and Ramlackhan Pamela
Home Financials for this Owner
Home Financials are based on the most recent Mortgage that was taken out on this home.
Original Mortgage
$146,650
Interest Rate
8.21%
Mortgage Type
FHA
Create a Home Valuation Report for This Property
The Home Valuation Report is an in-depth analysis detailing your home's value as well as a comparison with similar homes in the area
Home Values in the Area
Average Home Value in this Area
Purchase History
| Date | Buyer | Sale Price | Title Company |
|---|---|---|---|
| Mallay Phillip | -- | -- | |
| Mallay Phillip | -- | -- | |
| Ramlackhan Rohan | -- | Commonwealth Land Title Ins | |
| Ramlackhan Rohan | -- | Commonwealth Land Title Ins | |
| Ramlackhan Rohan | $148,000 | Commonwealth Land Title Ins | |
| Ramlackhan Rohan | $148,000 | Commonwealth Land Title Ins |
Source: Public Records
Mortgage History
| Date | Status | Borrower | Loan Amount |
|---|---|---|---|
| Previous Owner | Mallay Phillip | $160,000 | |
| Previous Owner | Ramlackhan Rohan | $146,650 |
Source: Public Records
Tax History Compared to Growth
Tax History
| Year | Tax Paid | Tax Assessment Tax Assessment Total Assessment is a certain percentage of the fair market value that is determined by local assessors to be the total taxable value of land and additions on the property. | Land | Improvement |
|---|---|---|---|---|
| 2025 | $6,157 | $32,248 | $7,058 | $25,190 |
| 2024 | $6,157 | $30,654 | $6,879 | $23,775 |
| 2023 | $6,058 | $30,164 | $7,448 | $22,716 |
| 2022 | $5,785 | $56,460 | $14,340 | $42,120 |
| 2021 | $5,655 | $49,860 | $14,340 | $35,520 |
| 2020 | $5,688 | $46,320 | $14,340 | $31,980 |
| 2019 | $5,344 | $40,260 | $14,340 | $25,920 |
| 2018 | $5,124 | $25,137 | $9,930 | $15,207 |
| 2017 | $4,839 | $23,736 | $9,377 | $14,359 |
| 2016 | $4,477 | $23,736 | $9,377 | $14,359 |
| 2015 | $2,481 | $22,394 | $13,242 | $9,152 |
| 2014 | $2,481 | $21,288 | $13,715 | $7,573 |
Source: Public Records
Map
Nearby Homes
- 184-09 Jamaica Ave
- 90-31 185th St
- 90-21 185th St
- 90-19 185th St
- 91-28 182nd Place
- 90-45 186th St
- 8931 184th St
- 91-19 182nd St
- 182-04 91st Ave
- 184-15 Henderson Ave
- 181-18 93rd Ave
- 185-05 Henderson Ave
- 102-13 183rd Place
- 8918 182nd Place
- 8829 184th St
- 9037 180th St
- 8839 186th St
- 188-09 Jamaica Ave
- 8908 182nd St
- 188-14 Woodhull Ave
- 18403 Jamaica Ave
- 184-03 Jamaica Ave
- 18405 Jamaica Ave
- 184-01 Jamaica Ave
- 18407 Jamaica Ave
- 18333 Jamaica Ave
- 9135 184th St
- 18409 Jamaica Ave
- 184-11 Jamaica Ave
- 18331 Jamaica Ave
- 18411 Jamaica Ave
- 9131 184th St
- 184-13 Jamaica Ave
- 18329 Jamaica Ave
- 18413 Jamaica Ave
- 91-36 184th St
- 91-25 184th St
- 91-32 184th St
- 9136 184th St
- 91-30 184th St