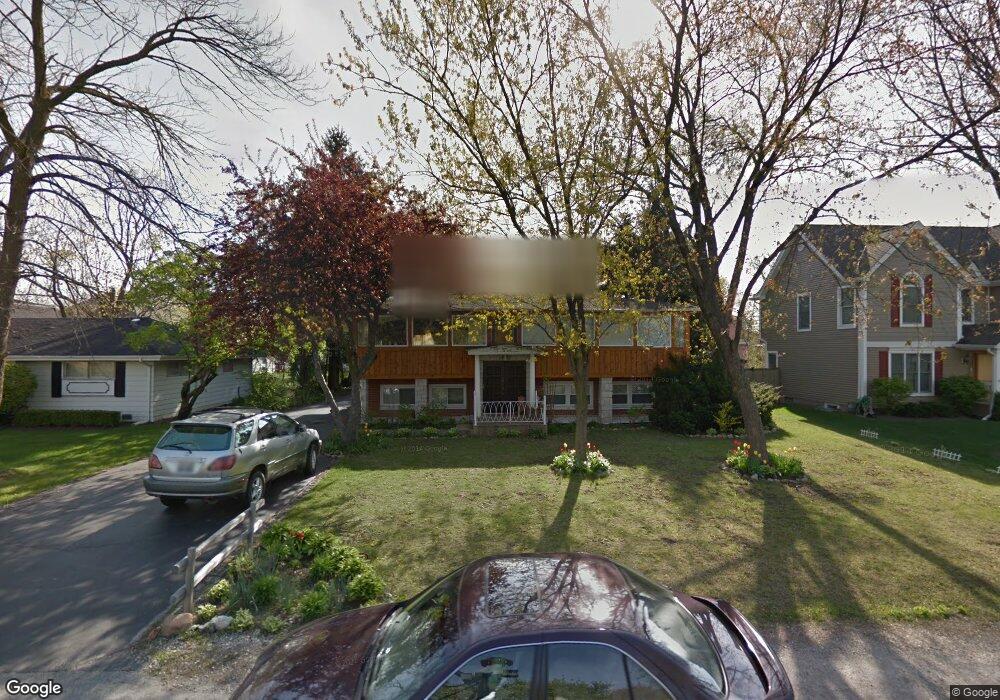
1841 Holly Ave Northbrook, IL 60062
Estimated Value: $420,000 - $536,501
3
Beds
2
Baths
1,170
Sq Ft
$421/Sq Ft
Est. Value
About This Home
This home is located at 1841 Holly Ave, Northbrook, IL 60062 and is currently estimated at $493,125, approximately $421 per square foot. 1841 Holly Ave is a home located in Cook County with nearby schools including Henry Winkelman Elementary School, Field Middle School, and Glenbrook North High School.
Ownership History
Date
Name
Owned For
Owner Type
Purchase Details
Closed on
Feb 11, 2010
Sold by
Cherednyk Oleh
Bought by
Cherednyk Oleh and Bielecki Svetlana
Current Estimated Value
Purchase Details
Closed on
Sep 2, 2003
Sold by
Savchenko Alexander and Savchenko Maria
Bought by
Cherednyk Oleh
Home Financials for this Owner
Home Financials are based on the most recent Mortgage that was taken out on this home.
Original Mortgage
$290,000
Outstanding Balance
$133,092
Interest Rate
6.44%
Mortgage Type
Unknown
Estimated Equity
$360,033
Purchase Details
Closed on
Dec 28, 1999
Sold by
Barder Vladimir and Barder Liya
Bought by
Savchenko Alexandr and Savchenko Maria
Home Financials for this Owner
Home Financials are based on the most recent Mortgage that was taken out on this home.
Original Mortgage
$208,800
Interest Rate
7.37%
Create a Home Valuation Report for This Property
The Home Valuation Report is an in-depth analysis detailing your home's value as well as a comparison with similar homes in the area
Home Values in the Area
Average Home Value in this Area
Purchase History
| Date | Buyer | Sale Price | Title Company |
|---|---|---|---|
| Cherednyk Oleh | -- | None Available | |
| Cherednyk Oleh | $333,000 | Multiple | |
| Savchenko Alexandr | $261,000 | Chicago Title Insurance Co |
Source: Public Records
Mortgage History
| Date | Status | Borrower | Loan Amount |
|---|---|---|---|
| Open | Cherednyk Oleh | $290,000 | |
| Previous Owner | Savchenko Alexandr | $208,800 |
Source: Public Records
Tax History
| Year | Tax Paid | Tax Assessment Tax Assessment Total Assessment is a certain percentage of the fair market value that is determined by local assessors to be the total taxable value of land and additions on the property. | Land | Improvement |
|---|---|---|---|---|
| 2025 | $6,666 | $37,000 | $10,000 | $27,000 |
| 2024 | $6,666 | $36,390 | $8,500 | $27,890 |
| 2023 | $6,592 | $36,390 | $8,500 | $27,890 |
| 2022 | $6,592 | $36,390 | $8,500 | $27,890 |
| 2021 | $5,190 | $25,853 | $9,500 | $16,353 |
| 2020 | $4,988 | $25,853 | $9,500 | $16,353 |
| 2019 | $5,431 | $28,102 | $9,500 | $18,602 |
| 2018 | $5,433 | $25,694 | $8,250 | $17,444 |
| 2017 | $5,330 | $25,694 | $8,250 | $17,444 |
| 2016 | $5,892 | $30,029 | $8,250 | $21,779 |
| 2015 | $5,640 | $26,140 | $7,000 | $19,140 |
| 2014 | $5,509 | $26,140 | $7,000 | $19,140 |
| 2013 | $5,393 | $26,140 | $7,000 | $19,140 |
Source: Public Records
Map
Nearby Homes
- 1649 Central Ave
- 3741 Mission Hills Rd Unit 102
- 3741 Mission Hills Rd Unit 410
- 1671 Mission Hills Rd Unit 302
- 1671 Mission Hills Rd Unit 201
- 3810 Mission Hills Rd Unit 107
- 3810 Mission Hills Rd Unit 306
- 3811 Mission Hills Rd Unit 1
- 1621 Mission Hills Rd Unit 108
- 2149 Post Rd
- 3860 Mission Hills Rd Unit 417
- 240 Violet Ln
- 250 Violet Ln
- 3899 Mission Hills Rd Unit 4
- 1864 Mission Hills Ln Unit 9D
- 1421 Hemlock Knoll Terrace
- 8 The Court of Charlwood
- 3075 Keystone Rd
- 6 the Court of Lagoon View
- 3 The Court of Harborside Unit 201
- 1829 Holly Ave
- 1853 Holly Ave
- 1840 Central Ave
- 1854 Central Ave
- 1828 Central Ave
- 1817 Holly Ave
- 3534 Garden St
- 1840 Holly Ave
- 3510 Garden St
- 1816 Central Ave
- 1828 Holly Ave
- 1852 Holly Ave
- 1805 Holly Ave
- 1818 Holly Ave
- 1804 Central Ave
- 1804 Holly Ave
- 1793 Holly Ave
- 1841 Central Ave
- 1853 Central Ave
- 1829 Central Ave
Your Personal Tour Guide
Ask me questions while you tour the home.