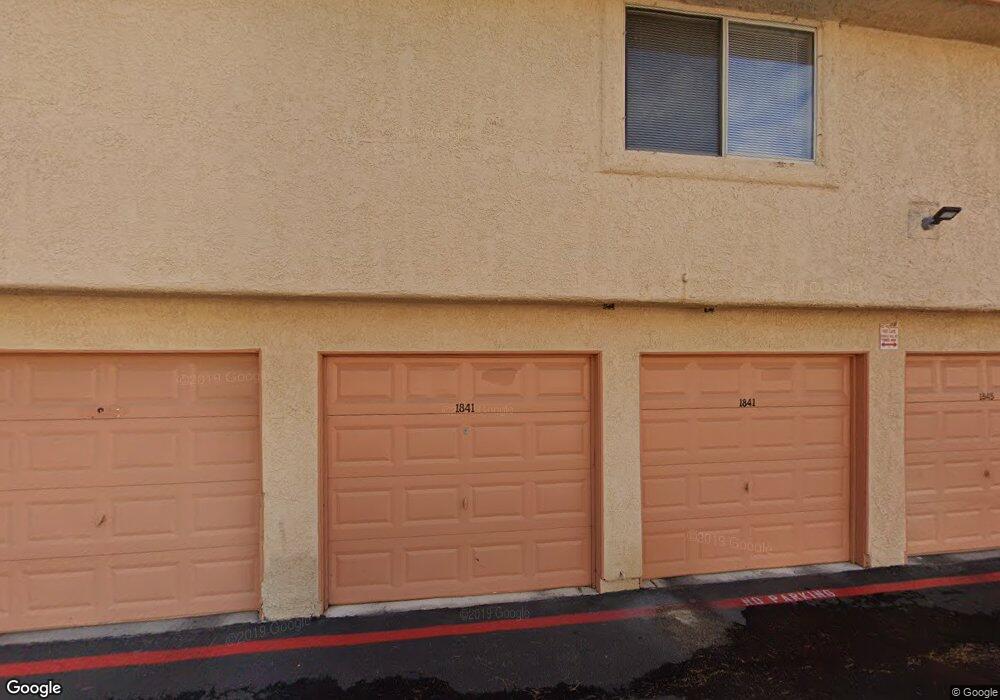
1841 Plum Ct Unit A Henderson, NV 89014
Green Valley North NeighborhoodEstimated Value: $274,000 - $288,000
3
Beds
2
Baths
1,176
Sq Ft
$240/Sq Ft
Est. Value
About This Home
This home is located at 1841 Plum Ct Unit A, Henderson, NV 89014 and is currently estimated at $282,187, approximately $239 per square foot. 1841 Plum Ct Unit A is a home located in Clark County with nearby schools including Harriet Treem Elementary School, Jim Thorpe Elementary School, and Francis H Cortney Junior High School.
Ownership History
Date
Name
Owned For
Owner Type
Purchase Details
Closed on
Oct 21, 2024
Sold by
Paul George Joseph
Bought by
George Joseph Paul Trust
Current Estimated Value
Purchase Details
Closed on
Oct 5, 2001
Sold by
Reiner Amy Monique and Abrams Amy Monique
Bought by
Paul George J and Paul Ruth
Home Financials for this Owner
Home Financials are based on the most recent Mortgage that was taken out on this home.
Original Mortgage
$85,850
Interest Rate
9.8%
Purchase Details
Closed on
Feb 11, 1997
Sold by
Yuratovich William T and Yuratovich Doris I
Bought by
Abrams Amy Monique
Home Financials for this Owner
Home Financials are based on the most recent Mortgage that was taken out on this home.
Original Mortgage
$85,850
Interest Rate
7.9%
Mortgage Type
FHA
Create a Home Valuation Report for This Property
The Home Valuation Report is an in-depth analysis detailing your home's value as well as a comparison with similar homes in the area
Home Values in the Area
Average Home Value in this Area
Purchase History
| Date | Buyer | Sale Price | Title Company |
|---|---|---|---|
| George Joseph Paul Trust | -- | None Listed On Document | |
| Paul George J | $101,000 | Nevada Title Company | |
| Reiner Amy Monique | -- | Nevada Title Company | |
| Abrams Amy Monique | $88,500 | United Title |
Source: Public Records
Mortgage History
| Date | Status | Borrower | Loan Amount |
|---|---|---|---|
| Previous Owner | Paul George J | $85,850 | |
| Previous Owner | Abrams Amy Monique | $85,850 |
Source: Public Records
Tax History Compared to Growth
Tax History
| Year | Tax Paid | Tax Assessment Tax Assessment Total Assessment is a certain percentage of the fair market value that is determined by local assessors to be the total taxable value of land and additions on the property. | Land | Improvement |
|---|---|---|---|---|
| 2025 | $613 | $58,831 | $21,350 | $37,481 |
| 2024 | $595 | $58,831 | $21,350 | $37,481 |
| 2023 | $595 | $59,355 | $24,500 | $34,855 |
| 2022 | $581 | $52,278 | $19,005 | $33,273 |
| 2021 | $565 | $45,245 | $17,500 | $27,745 |
| 2020 | $587 | $46,478 | $17,500 | $28,978 |
| 2019 | $530 | $42,939 | $14,000 | $28,939 |
| 2018 | $514 | $36,807 | $8,750 | $28,057 |
| 2017 | $1,014 | $34,975 | $6,650 | $28,325 |
| 2016 | $526 | $33,137 | $5,600 | $27,537 |
| 2015 | $523 | $27,642 | $3,850 | $23,792 |
| 2014 | $508 | $17,009 | $3,500 | $13,509 |
Source: Public Records
Map
Nearby Homes
- 1843 Mimosa Ct
- 1818 Somersby Way
- 1823 Rapier Dr Unit 1823
- 572 Cervantes Dr
- 1808 Michael Ct
- 1939 Cutlass Dr Unit 92
- 1947 Cutlass Dr Unit 88
- 1979 Cutlass Dr Unit 72
- 615 Cervantes Dr
- 2695 Dulcinea Dr
- 1723 Comstock Dr
- 844 Flowing Meadow Dr
- 1700 Empire Mine Dr
- 1701 Comstock Dr
- 505 Meadbury Dr
- 1699 Sonoran Bluff Ave
- 1947 Sundown Canyon Dr
- 2416 Greens Ave
- 426 Lost Trail Dr
- 2220 Marlboro Dr
- 1845 Plum Ct Unit C
- 1847 Plum Ct
- 1843 Plum Ct
- 1855 Plum Ct Unit n/a
- 1853 Plum Ct Unit 1853
- 1851 Plum Ct Unit C
- 1849 Plum Ct
- 1853 Plum Ct
- 1855 Plum Ct
- 1853 Plum Ct Unit none
- 1837 Plum Ct
- 1833 Plum Ct Unit D
- 1835 Plum Ct
- 1840 Plum Ct
- 1838 Plum Ct
- 1834 Plum Ct
- 1836 Plum Ct
- 1839 Plum Ct
- 1826 Somersby Way
- 1824 Somersby Way