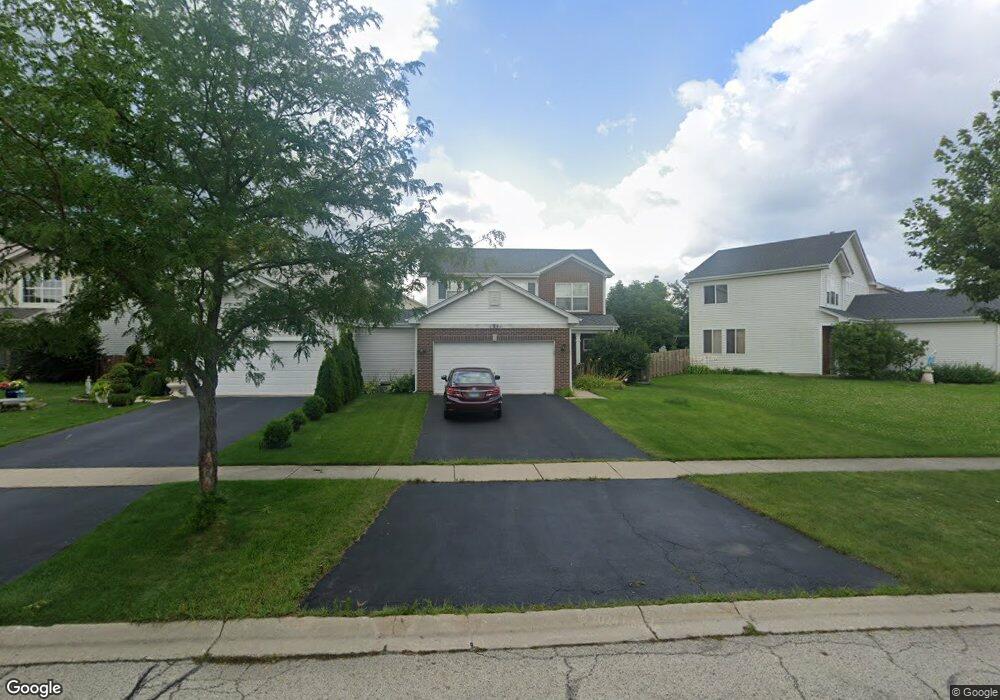
1841 S Mark Ln Unit 1 Round Lake, IL 60073
Estimated Value: $260,000 - $313,865
3
Beds
3
Baths
1,612
Sq Ft
$181/Sq Ft
Est. Value
About This Home
This home is located at 1841 S Mark Ln Unit 1, Round Lake, IL 60073 and is currently estimated at $291,966, approximately $181 per square foot. 1841 S Mark Ln Unit 1 is a home located in Lake County with nearby schools including Fremont Elementary School, Fremont Intermediate School, and Fremont Jr High/Middle School.
Ownership History
Date
Name
Owned For
Owner Type
Purchase Details
Closed on
Jul 16, 2010
Sold by
Blair John W
Bought by
Blair John W and Blair Mary E
Current Estimated Value
Home Financials for this Owner
Home Financials are based on the most recent Mortgage that was taken out on this home.
Original Mortgage
$130,500
Outstanding Balance
$82,416
Interest Rate
3.75%
Mortgage Type
New Conventional
Estimated Equity
$209,550
Purchase Details
Closed on
Mar 27, 2008
Sold by
Hsbc Mortgage Services Inc
Bought by
Blair John W
Home Financials for this Owner
Home Financials are based on the most recent Mortgage that was taken out on this home.
Original Mortgage
$134,950
Interest Rate
6.1%
Mortgage Type
Unknown
Purchase Details
Closed on
Sep 17, 2007
Sold by
Bonilla Alicia A
Bought by
Hsbc Mortgage Services Inc
Purchase Details
Closed on
Sep 30, 2004
Sold by
Lakewood Grove Llc
Bought by
Bonilla Alicia A
Home Financials for this Owner
Home Financials are based on the most recent Mortgage that was taken out on this home.
Original Mortgage
$186,900
Interest Rate
5.93%
Mortgage Type
Unknown
Create a Home Valuation Report for This Property
The Home Valuation Report is an in-depth analysis detailing your home's value as well as a comparison with similar homes in the area
Home Values in the Area
Average Home Value in this Area
Purchase History
| Date | Buyer | Sale Price | Title Company |
|---|---|---|---|
| Blair John W | -- | Fidelity | |
| Blair John W | $150,000 | First American Title | |
| Hsbc Mortgage Services Inc | -- | None Available | |
| Bonilla Alicia A | $197,000 | -- |
Source: Public Records
Mortgage History
| Date | Status | Borrower | Loan Amount |
|---|---|---|---|
| Open | Blair John W | $130,500 | |
| Closed | Blair John W | $134,950 | |
| Previous Owner | Bonilla Alicia A | $186,900 |
Source: Public Records
Tax History Compared to Growth
Tax History
| Year | Tax Paid | Tax Assessment Tax Assessment Total Assessment is a certain percentage of the fair market value that is determined by local assessors to be the total taxable value of land and additions on the property. | Land | Improvement |
|---|---|---|---|---|
| 2024 | $7,599 | $77,021 | $15,145 | $61,876 |
| 2023 | $7,159 | $67,857 | $13,343 | $54,514 |
| 2022 | $7,159 | $60,926 | $14,021 | $46,905 |
| 2021 | $6,526 | $54,831 | $13,048 | $41,783 |
| 2020 | $6,129 | $49,802 | $12,104 | $37,698 |
| 2019 | $5,976 | $48,164 | $11,706 | $36,458 |
| 2018 | $5,285 | $41,909 | $11,062 | $30,847 |
| 2017 | $5,232 | $40,590 | $10,714 | $29,876 |
| 2016 | $5,207 | $38,551 | $10,176 | $28,375 |
| 2015 | $3,520 | $36,141 | $9,540 | $26,601 |
| 2014 | $3,586 | $37,067 | $9,860 | $27,207 |
| 2012 | $3,983 | $37,397 | $9,948 | $27,449 |
Source: Public Records
Map
Nearby Homes
- 1823 S Fallbrook Dr
- 530 W Kristina Ln Unit 3904
- 1851 S Hamlin Ln Unit 2
- 1759 S Fallbrook Dr
- 645 W Jonathan Dr Unit 3
- 593 W Hamlin Ln Unit 1
- 2043 S Kristina Ln Unit 3
- 1519 S Elizabeth Ln Unit 1
- 1476 S Wild Meadow Rd
- 247 W Olmsted Ln
- 261 Rodeo Dr
- 0 W Chardon Rd
- 305 Legacy Ct
- 328 Legacy Ct
- 296 W Prairie Walk Ln
- 115 Hunter Ct
- 438 W Meadow Mist Ln
- 246 W Winding Trail Cir
- 24570 W Chardon Rd
- 178 W Hampton Dr
- 1841 S Mark Ln
- 1841 S Mark Ln Unit 2
- 1837 S Mark Ln Unit 3561
- 1851 S Mark Ln
- 1827 S Mark Ln
- 1827 S Mark Ln Unit 1827
- 1827 S Mark Ln Unit 2
- 1861 S Mark Ln Unit 3572
- 1840 S Fallbrook Dr Unit 2
- 1836 S Fallbrook Dr Unit 2
- 1821 S Mark Ln
- 1854 S Fallbrook Dr
- 1854 S Fallbrook Dr Unit 1
- 1830 S Fallbrook Dr
- 1830 S Fallbrook Dr Unit 1830
- 1813 S Mark Ln Unit 2
- 1858 S Fallbrook Dr Unit 2
- 1826 S Fallbrook Dr Unit 2
- 1826 S Fallbrook Dr
- 1838 S Mark Ln