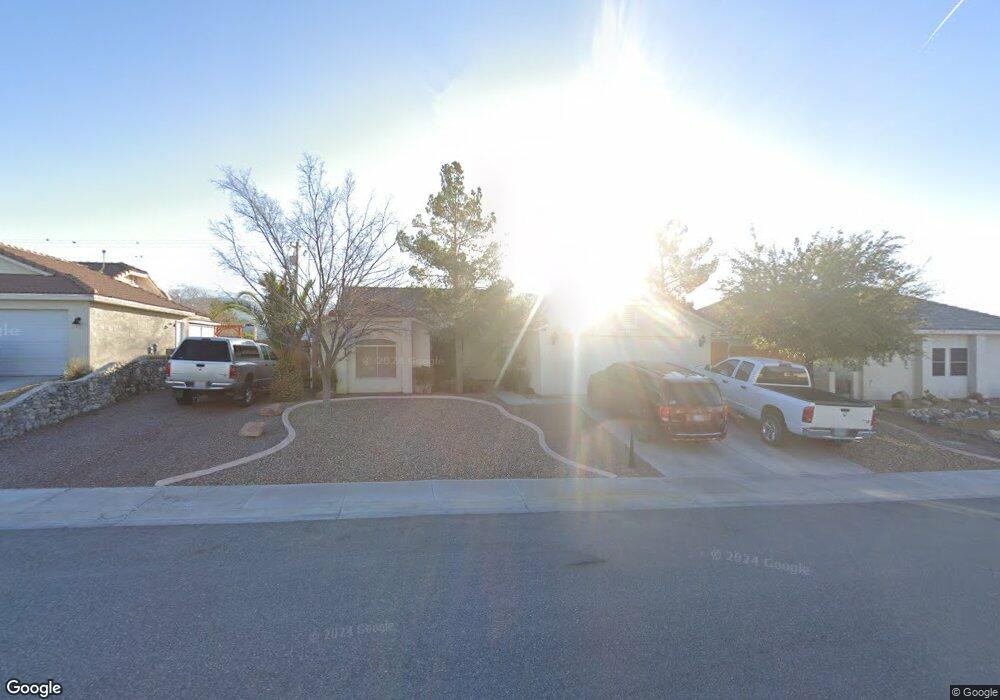
1841 S Vineyard Dr E Pahrump, NV 89048
Estimated Value: $338,560 - $375,000
--
Bed
--
Bath
1,556
Sq Ft
$230/Sq Ft
Est. Value
About This Home
This home is located at 1841 S Vineyard Dr E, Pahrump, NV 89048 and is currently estimated at $358,640, approximately $230 per square foot. 1841 S Vineyard Dr E is a home located in Nye County with nearby schools including Hafen Elementary School, Rosemary Clarke Middle School, and Pahrump Valley High School.
Ownership History
Date
Name
Owned For
Owner Type
Purchase Details
Closed on
Oct 29, 2021
Sold by
Barentine Jason Sean and Barentine Sarah Marie
Bought by
Barentine Jason Sean and Barentine Sarah Marie
Current Estimated Value
Home Financials for this Owner
Home Financials are based on the most recent Mortgage that was taken out on this home.
Original Mortgage
$187,840
Outstanding Balance
$172,171
Interest Rate
3.01%
Mortgage Type
New Conventional
Estimated Equity
$186,469
Purchase Details
Closed on
Nov 13, 2019
Sold by
Barentine Jason Sean
Bought by
Barentine Jason Sean and Barentine Sarah Marie
Purchase Details
Closed on
Sep 18, 2014
Sold by
Barentine Sarah
Bought by
Barentine Jason Sean
Home Financials for this Owner
Home Financials are based on the most recent Mortgage that was taken out on this home.
Original Mortgage
$152,959
Interest Rate
4.2%
Mortgage Type
New Conventional
Purchase Details
Closed on
May 8, 2006
Sold by
Guin Raymond
Bought by
Raymond E Guin Jr Revocable Trust
Create a Home Valuation Report for This Property
The Home Valuation Report is an in-depth analysis detailing your home's value as well as a comparison with similar homes in the area
Home Values in the Area
Average Home Value in this Area
Purchase History
| Date | Buyer | Sale Price | Title Company |
|---|---|---|---|
| Barentine Jason Sean | -- | Amrock Llc | |
| Barentine Jason Sean | -- | Amrock | |
| Barentine Jason Sean | -- | None Available | |
| Barentine Jason Sean | -- | Markem Title Co | |
| Barentine Jason Sean | $149,900 | Markem Title Co | |
| Raymond E Guin Jr Revocable Trust | -- | None Available | |
| Guin Raymond | -- | None Available |
Source: Public Records
Mortgage History
| Date | Status | Borrower | Loan Amount |
|---|---|---|---|
| Open | Barentine Jason Sean | $187,840 | |
| Closed | Barentine Jason Sean | $152,959 |
Source: Public Records
Tax History Compared to Growth
Tax History
| Year | Tax Paid | Tax Assessment Tax Assessment Total Assessment is a certain percentage of the fair market value that is determined by local assessors to be the total taxable value of land and additions on the property. | Land | Improvement |
|---|---|---|---|---|
| 2025 | $1,481 | $57,129 | $4,466 | $52,663 |
| 2024 | $1,481 | $58,185 | $4,466 | $53,719 |
| 2023 | $1,481 | $53,723 | $4,466 | $49,257 |
| 2022 | $1,395 | $49,614 | $4,466 | $45,148 |
| 2021 | $1,358 | $47,117 | $3,573 | $43,544 |
| 2020 | $1,111 | $41,999 | $3,573 | $38,426 |
| 2019 | $1,078 | $51,458 | $3,573 | $47,885 |
| 2018 | $1,031 | $49,157 | $2,858 | $46,299 |
| 2017 | $991 | $39,724 | $2,858 | $36,866 |
| 2016 | $967 | $28,093 | $2,858 | $25,235 |
| 2015 | $965 | $26,110 | $2,858 | $23,252 |
| 2014 | $936 | $28,105 | $2,858 | $25,247 |
Source: Public Records
Map
Nearby Homes
- 3640 E Vineyard Dr N
- 1931 S Rose Ct
- 2081 Tucuman Ave
- 2061 Iroquois Ave
- 2260 Iroquois Ave
- 2241 Iroquois Ave
- 2161 Tiawah Ave
- 2240 S Tucuman Ave
- 2300 Washoe Ave
- 3261 Winery Rd
- 3240 Kaibab St
- 3241 E Winery Rd
- 2181 E Winery Rd
- 2301 Pampa Ave
- 2261 Pampa Ave
- 2281 Pampa Ave
- 1900 Cortina St
- 1961 Cortina St
- 3030 Cortina St
- 1961 S Omaha Ave
- 1821 S Vineyard Dr E
- 1861 S Vineyard Dr E
- 1801 S Vineyard Dr E
- 3631 E Burgundy Dr
- 1880 S Vineyard Dr E
- 3630 E Burgundy Dr
- 1781 S Vineyard Dr E
- 3621 E Burgundy Dr
- 3620 E Burgundy Dr
- 3631 E Vineyard Dr N
- 1900 S Vineyard Dr E
- 1901 S Vineyard Dr E
- 3621 E Vineyard Dr N
- 3611 E Burgundy Dr
- 3610 E Burgundy Dr
- 3610 E Chablis St N
- 3621 E Chablis St N
- 3611 E Vineyard Dr N
- 1910 S Vineyard Dr E
- 1911 S Vineyard Dr E