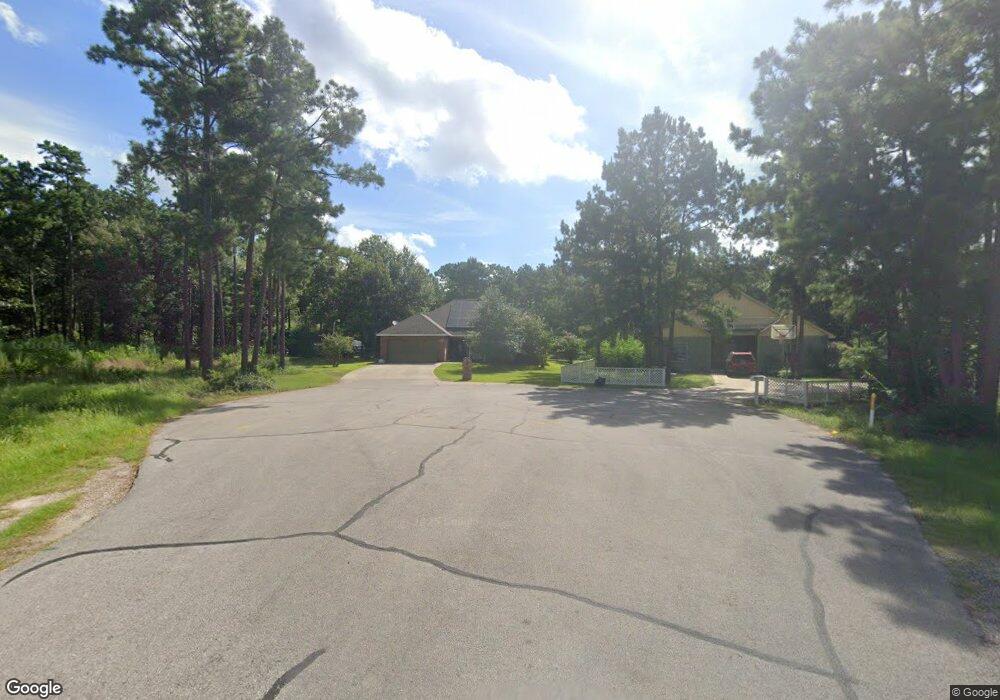
18410 Connie Ave Magnolia, TX 77355
Estimated Value: $261,000 - $369,000
3
Beds
2
Baths
1,543
Sq Ft
$209/Sq Ft
Est. Value
About This Home
This home is located at 18410 Connie Ave, Magnolia, TX 77355 and is currently estimated at $321,879, approximately $208 per square foot. 18410 Connie Ave is a home located in Montgomery County with nearby schools including Nichols Sawmill Elementary School, Magnolia Sixth Grade Campus, and Magnolia Junior High School.
Ownership History
Date
Name
Owned For
Owner Type
Purchase Details
Closed on
Dec 19, 2016
Sold by
Nedbal Mary L and Nedbal Mary Lou
Bought by
Garcia Ramiro C and Garcia Carmen D
Current Estimated Value
Home Financials for this Owner
Home Financials are based on the most recent Mortgage that was taken out on this home.
Original Mortgage
$125,000
Outstanding Balance
$81,005
Interest Rate
3.57%
Mortgage Type
New Conventional
Estimated Equity
$240,874
Purchase Details
Closed on
Jul 29, 2011
Sold by
Welborn Garry
Bought by
Garcia Ramiro C and Garcia Carmen D
Purchase Details
Closed on
Dec 15, 2005
Sold by
Simon Jorge
Bought by
Welborn Garry
Purchase Details
Closed on
Oct 29, 2002
Sold by
Grote Tammy Denise
Bought by
Simon Jorge
Create a Home Valuation Report for This Property
The Home Valuation Report is an in-depth analysis detailing your home's value as well as a comparison with similar homes in the area
Home Values in the Area
Average Home Value in this Area
Purchase History
| Date | Buyer | Sale Price | Title Company |
|---|---|---|---|
| Garcia Ramiro C | -- | Providence Title Company | |
| Garcia Ramiro C | -- | -- | |
| Welborn Garry | -- | Alamo Title Company | |
| Simon Jorge | -- | Alamo Title Company |
Source: Public Records
Mortgage History
| Date | Status | Borrower | Loan Amount |
|---|---|---|---|
| Open | Garcia Ramiro C | $125,000 |
Source: Public Records
Tax History Compared to Growth
Tax History
| Year | Tax Paid | Tax Assessment Tax Assessment Total Assessment is a certain percentage of the fair market value that is determined by local assessors to be the total taxable value of land and additions on the property. | Land | Improvement |
|---|---|---|---|---|
| 2025 | $4,756 | $333,019 | $41,272 | $291,747 |
| 2024 | $4,352 | $329,241 | -- | -- |
| 2023 | $4,352 | $299,310 | $41,270 | $277,130 |
| 2022 | $5,822 | $272,100 | $41,270 | $277,130 |
| 2021 | $5,600 | $247,360 | $41,270 | $206,090 |
| 2020 | $5,753 | $231,200 | $41,270 | $206,090 |
| 2019 | $5,215 | $210,180 | $41,270 | $223,680 |
| 2018 | $4,357 | $191,070 | $37,150 | $223,680 |
| 2017 | $4,487 | $173,700 | $37,150 | $136,550 |
| 2016 | $5,445 | $210,770 | $3,500 | $207,270 |
| 2015 | $4,122 | $214,990 | $3,500 | $211,490 |
| 2014 | $4,122 | $158,060 | $3,500 | $154,560 |
Source: Public Records
Map
Nearby Homes
- 30812 Willow Green Ln
- 18523 Burch Creek Ln
- 18618 N Sugar Maple Cir Unit 109
- 18666 Legend Oaks Dr
- 18655 Limber Pines Ct Unit 25
- 30367 Limber Pines Dr
- 18672 Limber Pines Ct Unit 2
- 18770 S Sugar Maple Cir Unit 136
- 38910 Fm 1774 Rd
- 19215 Veterans Rd
- 18624 Birch Orchard Ct
- 30403 Red Alder Cir Unit 48
- 21119 Aspen Adela Cove
- 21250 Natalia Grove
- 18616 Birch Orchard Ct
- 30435 Valley Oaks Dr Unit 63
- 18827 Squirrel Oaks Dr
- 18864 Aspen Briar Cir
- 18906 Knobby Oaks Place
- 28102 Nichols Sawmill Rd
- 18411 Connie Ave
- 18426 Connie Ave
- 18427 Connie
- 18471 Connie Ave
- 30808 Willow Green Ln
- 18511 Connie Ave
- 18511 Connie St
- 30836 Willow Green Ln
- 30840 Willow Green Ln
- 30800 Willow Green Ln
- 18510 Connie Ave
- 30628 Caney Springs Ln
- 18636 Caney Springs Ln
- 18637 Caney Springs Ln
- 18543 Burch Creek Ln
- 18515 Connie St
- 18548 Burch Creek Ln
- 18632 Caney Springs Ln
- 18633 Caney Springs Ln
- 18739 Creek Falls Ln