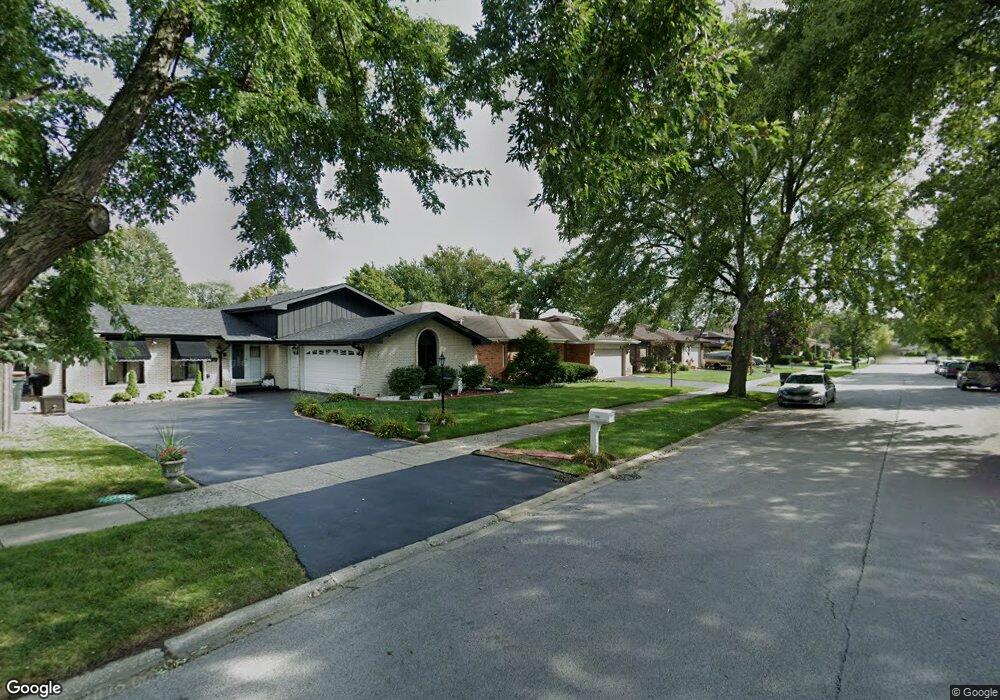
18411 Maple St Lansing, IL 60438
Estimated Value: $273,020 - $342,000
4
Beds
2
Baths
1,568
Sq Ft
$188/Sq Ft
Est. Value
About This Home
This home is located at 18411 Maple St, Lansing, IL 60438 and is currently estimated at $295,005, approximately $188 per square foot. 18411 Maple St is a home located in Cook County with nearby schools including Coolidge Elementary School, Memorial Jr High School, and Thornton Fractnl So High School.
Ownership History
Date
Name
Owned For
Owner Type
Purchase Details
Closed on
Sep 26, 2005
Sold by
Donald Robert and Poomduang Vicharn
Bought by
Donald Robert and Poomduang Donald Vipaporn
Current Estimated Value
Purchase Details
Closed on
Jun 1, 2004
Sold by
Mb Financial Bank Na
Bought by
Donald Robert and Poomduang Vicharn
Home Financials for this Owner
Home Financials are based on the most recent Mortgage that was taken out on this home.
Original Mortgage
$199,863
Interest Rate
6.34%
Mortgage Type
FHA
Purchase Details
Closed on
Oct 2, 1995
Sold by
Skorch David L and Skorch Diane
Bought by
Adams James R and Adams Joellen
Home Financials for this Owner
Home Financials are based on the most recent Mortgage that was taken out on this home.
Original Mortgage
$80,000
Interest Rate
7.91%
Create a Home Valuation Report for This Property
The Home Valuation Report is an in-depth analysis detailing your home's value as well as a comparison with similar homes in the area
Home Values in the Area
Average Home Value in this Area
Purchase History
| Date | Buyer | Sale Price | Title Company |
|---|---|---|---|
| Donald Robert | -- | -- | |
| Donald Robert | $203,000 | Pntn | |
| Adams James R | $145,000 | -- |
Source: Public Records
Mortgage History
| Date | Status | Borrower | Loan Amount |
|---|---|---|---|
| Previous Owner | Donald Robert | $199,863 | |
| Previous Owner | Adams James R | $80,000 |
Source: Public Records
Tax History
| Year | Tax Paid | Tax Assessment Tax Assessment Total Assessment is a certain percentage of the fair market value that is determined by local assessors to be the total taxable value of land and additions on the property. | Land | Improvement |
|---|---|---|---|---|
| 2025 | $10,008 | $24,000 | $3,762 | $20,238 |
| 2024 | $10,008 | $24,000 | $3,762 | $20,238 |
| 2023 | $7,460 | $24,000 | $3,762 | $20,238 |
| 2022 | $7,460 | $14,900 | $3,249 | $11,651 |
| 2021 | $7,313 | $14,899 | $3,249 | $11,650 |
| 2020 | $6,921 | $14,899 | $3,249 | $11,650 |
| 2019 | $6,552 | $14,938 | $2,736 | $12,202 |
| 2018 | $6,427 | $14,938 | $2,736 | $12,202 |
| 2017 | $6,524 | $14,938 | $2,736 | $12,202 |
| 2016 | $6,063 | $13,586 | $2,565 | $11,021 |
| 2015 | $5,570 | $13,586 | $2,565 | $11,021 |
| 2014 | $5,520 | $13,586 | $2,565 | $11,021 |
| 2013 | $5,350 | $14,511 | $2,565 | $11,946 |
Source: Public Records
Map
Nearby Homes
- 18358 Willow Ln
- 18443 Maple St
- 18405 Wentworth Ave Unit 1D
- 18504 Wentworth Ave
- 3620 186th St Unit 405
- 18215 Wentworth Ave Unit 3B
- 218 Sunset Ln
- 8546 Hohman Ave
- 18158 Lange St
- 249 Briar Ln
- 18 Timrick Dr
- 18309 Grant St
- 18634 Bernadine St
- 8147 Hohman Ave
- 3527 Lake St
- 3359 Ann St
- 18644 William St
- 18275 Ada St
- 8138 Highland Place
- 8039 Forest Ave
- 18407 Maple St
- 18415 Maple St
- 18410 Willow Ln
- 18419 Maple St
- 18416 Willow Ln
- 18404 Willow Ln
- 18403 Maple St
- 18422 Willow Ln
- 18414 Maple St
- 18410 Maple St
- 18423 Maple St
- 18418 Maple St
- 18406 Maple St
- 18434 Willow Ln
- 18434 Willow Ln
- 18422 Maple St
- 18428 Willow Ln
- 18428 Willow Ln
- 18402 Maple St
- 18427 Maple St
Your Personal Tour Guide
Ask me questions while you tour the home.