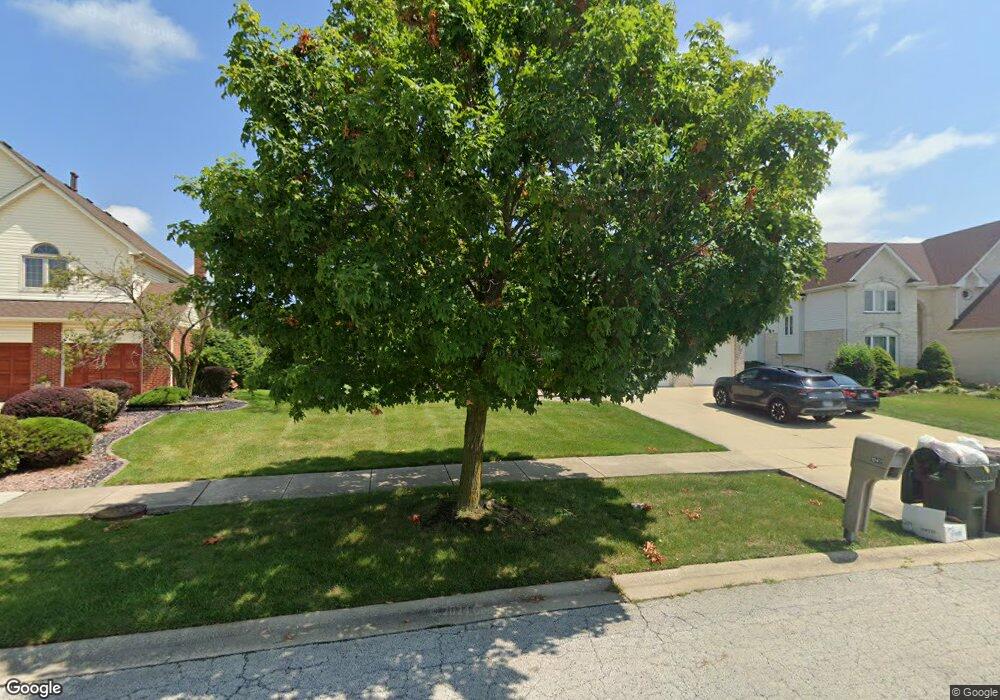
18411 River Rd Hazel Crest, IL 60429
Village West NeighborhoodEstimated Value: $433,837 - $510,000
4
Beds
4
Baths
3,365
Sq Ft
$139/Sq Ft
Est. Value
About This Home
This home is located at 18411 River Rd, Hazel Crest, IL 60429 and is currently estimated at $469,209, approximately $139 per square foot. 18411 River Rd is a home located in Cook County with nearby schools including Flossmoor Hills Elementary School, Parker Junior High School, and Homewood-Flossmoor High School.
Ownership History
Date
Name
Owned For
Owner Type
Purchase Details
Closed on
Aug 2, 2017
Sold by
Fannie Mae
Bought by
Petties Quentin
Current Estimated Value
Home Financials for this Owner
Home Financials are based on the most recent Mortgage that was taken out on this home.
Original Mortgage
$274,631
Outstanding Balance
$225,319
Interest Rate
3.62%
Mortgage Type
FHA
Estimated Equity
$243,890
Purchase Details
Closed on
Feb 23, 2016
Sold by
Simpson Floyd R and Simpson Floyd
Bought by
Federal National Mortgage Association and Fannie Mae
Purchase Details
Closed on
May 5, 1997
Sold by
Grand Premier Trust & Investment Inc Na
Bought by
Simpson Floyd and Simpson Jeanette
Home Financials for this Owner
Home Financials are based on the most recent Mortgage that was taken out on this home.
Original Mortgage
$207,000
Interest Rate
8.05%
Create a Home Valuation Report for This Property
The Home Valuation Report is an in-depth analysis detailing your home's value as well as a comparison with similar homes in the area
Home Values in the Area
Average Home Value in this Area
Purchase History
| Date | Buyer | Sale Price | Title Company |
|---|---|---|---|
| Petties Quentin | -- | First American Title Insuran | |
| Federal National Mortgage Association | -- | Attorney | |
| Simpson Floyd | $314,500 | -- |
Source: Public Records
Mortgage History
| Date | Status | Borrower | Loan Amount |
|---|---|---|---|
| Open | Petties Quentin | $274,631 | |
| Previous Owner | Simpson Floyd | $207,000 |
Source: Public Records
Tax History
| Year | Tax Paid | Tax Assessment Tax Assessment Total Assessment is a certain percentage of the fair market value that is determined by local assessors to be the total taxable value of land and additions on the property. | Land | Improvement |
|---|---|---|---|---|
| 2025 | $19,352 | $40,000 | $8,405 | $31,595 |
| 2024 | $19,352 | $40,000 | $8,405 | $31,595 |
| 2023 | $15,330 | $40,000 | $8,405 | $31,595 |
| 2022 | $15,330 | $24,553 | $7,396 | $17,157 |
| 2021 | $15,210 | $24,553 | $7,396 | $17,157 |
| 2020 | $14,381 | $24,553 | $7,396 | $17,157 |
| 2019 | $14,441 | $24,228 | $6,724 | $17,504 |
| 2018 | $16,174 | $24,228 | $6,724 | $17,504 |
| 2017 | $13,233 | $24,228 | $6,724 | $17,504 |
| 2016 | $12,845 | $23,384 | $6,051 | $17,333 |
| 2015 | $12,582 | $23,384 | $6,051 | $17,333 |
| 2014 | $12,207 | $23,384 | $6,051 | $17,333 |
| 2013 | $10,651 | $22,876 | $6,051 | $16,825 |
Source: Public Records
Map
Nearby Homes
- 3600 183rd St
- 18600 Village West Dr Unit 310
- 18600 Village West Dr Unit 303
- 3710 Briar Ln
- 3800 River Rd
- 3902 Edgewater Dr
- 3360 184th St Unit 3W
- 3360 184th St Unit 1E
- 18018 Chantilly Ln Unit S3
- 4445 Provincetown Dr
- 3314 185th Place
- 754 Central Park Ave
- 3406 Seine Ct
- 173 Williamsburg Rd Unit 1
- 3641 Beech St
- 3400 Seine Ct
- 3712 Beech St
- 800 Elm St
- 4036 W 187th St
- 1115 Williamsburg Rd Unit 1
- 18413 River Rd
- 18407 River Rd
- 18415 River Rd
- 18412 River Rd
- 18410 River Rd
- 18414 River Rd
- 3604 Edgewater Dr
- 18501 River Rd Unit 4
- 18500 River Rd
- 3701 Streamwood Dr
- 3606 Edgewater Dr
- 3703 Edgewater Dr
- 18503 River Rd
- 3700 Streamwood Dr
- 3703 Streamwood Dr
- 18501 Alexis Ct
- 18505 River Rd
- 3608 Edgewater Dr
- 3702 Streamwood Dr
Your Personal Tour Guide
Ask me questions while you tour the home.