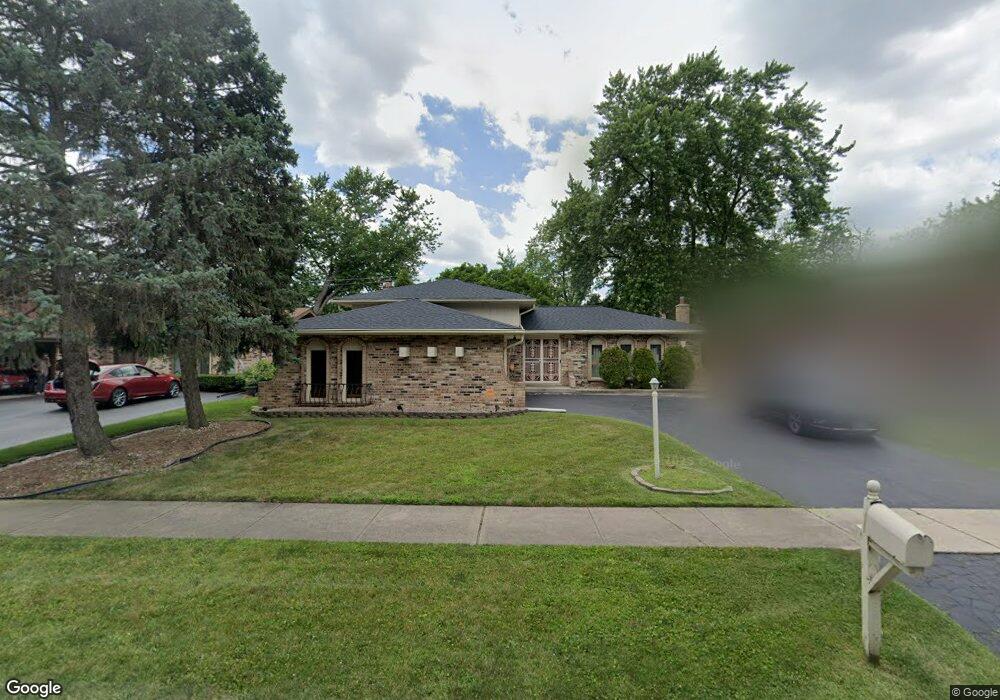
18412 Lange St Lansing, IL 60438
Estimated Value: $271,230 - $324,000
4
Beds
3
Baths
1,379
Sq Ft
$217/Sq Ft
Est. Value
About This Home
This home is located at 18412 Lange St, Lansing, IL 60438 and is currently estimated at $299,058, approximately $216 per square foot. 18412 Lange St is a home located in Cook County with nearby schools including Coolidge Elementary School, Memorial Jr High School, and Thornton Fractnl So High School.
Ownership History
Date
Name
Owned For
Owner Type
Purchase Details
Closed on
Jul 18, 2007
Sold by
Salas Antonio and Salas Maria
Bought by
Easton John and Booker Nuell
Current Estimated Value
Home Financials for this Owner
Home Financials are based on the most recent Mortgage that was taken out on this home.
Original Mortgage
$172,000
Interest Rate
6.66%
Mortgage Type
Unknown
Purchase Details
Closed on
Aug 23, 2005
Sold by
Mueller Day Linda L and Mueller Linda L
Bought by
Salas Antonio and Rueda Dorotea
Home Financials for this Owner
Home Financials are based on the most recent Mortgage that was taken out on this home.
Original Mortgage
$180,000
Interest Rate
5.89%
Mortgage Type
Fannie Mae Freddie Mac
Purchase Details
Closed on
May 16, 2001
Sold by
Mueller Gerold G
Bought by
Mueller Linda L
Create a Home Valuation Report for This Property
The Home Valuation Report is an in-depth analysis detailing your home's value as well as a comparison with similar homes in the area
Home Values in the Area
Average Home Value in this Area
Purchase History
| Date | Buyer | Sale Price | Title Company |
|---|---|---|---|
| Easton John | $215,000 | None Available | |
| Salas Antonio | $200,000 | To | |
| Mueller Linda L | -- | -- |
Source: Public Records
Mortgage History
| Date | Status | Borrower | Loan Amount |
|---|---|---|---|
| Previous Owner | Easton John | $172,000 | |
| Previous Owner | Salas Antonio | $180,000 |
Source: Public Records
Tax History Compared to Growth
Tax History
| Year | Tax Paid | Tax Assessment Tax Assessment Total Assessment is a certain percentage of the fair market value that is determined by local assessors to be the total taxable value of land and additions on the property. | Land | Improvement |
|---|---|---|---|---|
| 2024 | $8,241 | $23,000 | $4,469 | $18,531 |
| 2023 | $3,696 | $23,000 | $4,469 | $18,531 |
| 2022 | $3,696 | $14,918 | $3,859 | $11,059 |
| 2021 | $3,501 | $14,918 | $3,859 | $11,059 |
| 2020 | $3,027 | $14,918 | $3,859 | $11,059 |
| 2019 | $3,247 | $14,658 | $3,250 | $11,408 |
| 2018 | $3,192 | $14,658 | $3,250 | $11,408 |
| 2017 | $3,167 | $14,658 | $3,250 | $11,408 |
| 2016 | $4,414 | $12,977 | $3,046 | $9,931 |
| 2015 | $4,308 | $12,977 | $3,046 | $9,931 |
| 2014 | $4,296 | $12,977 | $3,046 | $9,931 |
| 2013 | $4,243 | $13,932 | $3,046 | $10,886 |
Source: Public Records
Map
Nearby Homes
- 18405 Wentworth Ave Unit 1D
- 18333 Wentworth Ave Unit 7
- 18416 Willow Ln
- 18358 Willow Ln
- 18443 Maple St
- 18504 Wentworth Ave
- 3640 186th St Unit 101
- 18215 Wentworth Ave Unit 3B
- 3620 186th St Unit 405
- 3627 Ridge Rd
- 18316 Sherman St
- 18275 Ada St
- 8546 Hohman Ave
- 18 Timrick Dr
- 249 Briar Ln
- 26 Timrick Dr
- 18302 Roy St
- 3251 N Schultz Dr
- 18747 Sherman St
- 8130 Meadow Ln
- 18408 Lange St
- 18416 Lange St
- 18404 Lange St
- 18420 Lange St
- 18413 Lange St
- 18409 Lange St
- 18424 Lange St
- 18421 Lange St
- 18360 Lange St Unit 2
- 18405 Lange St
- 18425 Lange St
- 18415 Wentworth Ave
- 18405 Wentworth Ave Unit 1C
- 18405 Wentworth Ave Unit 2C
- 18405 Wentworth Ave Unit 1A
- 18405 Wentworth Ave Unit 2B
- 18405 Wentworth Ave Unit 2A
- 18405 Wentworth Ave Unit 2D
- 18405 Wentworth Ave Unit 1B
- 18405 Wentworth Ave Unit 3D