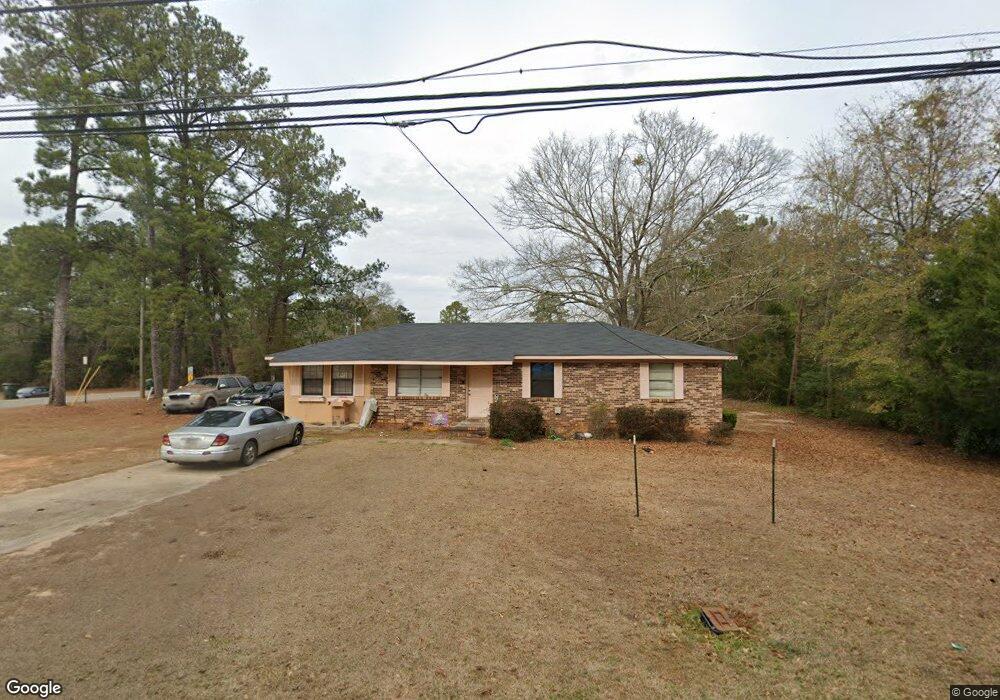
18415 E South Blvd Blakely, GA 39823
Estimated Value: $67,000 - $103,000
3
Beds
1
Bath
1,350
Sq Ft
$60/Sq Ft
Est. Value
About This Home
This home is located at 18415 E South Blvd, Blakely, GA 39823 and is currently estimated at $80,930, approximately $59 per square foot. 18415 E South Blvd is a home located in Early County with nearby schools including Early County Elementary School, Early County Middle School, and Early County High School.
Ownership History
Date
Name
Owned For
Owner Type
Purchase Details
Closed on
Nov 22, 2024
Sold by
Mmw Rentals Llc
Bought by
Riley James Investment Properties Llc
Current Estimated Value
Home Financials for this Owner
Home Financials are based on the most recent Mortgage that was taken out on this home.
Original Mortgage
$60,541
Outstanding Balance
$47,203
Interest Rate
6.54%
Mortgage Type
New Conventional
Estimated Equity
$33,727
Purchase Details
Closed on
May 12, 2017
Sold by
Cochran Evelyn Gonzales
Bought by
Mmw Rentals Llc
Home Financials for this Owner
Home Financials are based on the most recent Mortgage that was taken out on this home.
Original Mortgage
$50,000
Interest Rate
4.08%
Mortgage Type
Unknown
Purchase Details
Closed on
Feb 4, 1994
Bought by
Cochran Evelyn R
Create a Home Valuation Report for This Property
The Home Valuation Report is an in-depth analysis detailing your home's value as well as a comparison with similar homes in the area
Home Values in the Area
Average Home Value in this Area
Purchase History
| Date | Buyer | Sale Price | Title Company |
|---|---|---|---|
| Riley James Investment Properties Llc | $65,000 | -- | |
| Mmw Rentals Llc | $51,000 | -- | |
| Cochran Evelyn R | -- | -- |
Source: Public Records
Mortgage History
| Date | Status | Borrower | Loan Amount |
|---|---|---|---|
| Open | Riley James Investment Properties Llc | $60,541 | |
| Previous Owner | Mmw Rentals Llc | $50,000 |
Source: Public Records
Tax History
| Year | Tax Paid | Tax Assessment Tax Assessment Total Assessment is a certain percentage of the fair market value that is determined by local assessors to be the total taxable value of land and additions on the property. | Land | Improvement |
|---|---|---|---|---|
| 2025 | $1,191 | $35,669 | $1,800 | $33,869 |
| 2024 | $862 | $27,898 | $2,400 | $25,498 |
| 2023 | $828 | $27,898 | $2,400 | $25,498 |
| 2022 | $707 | $28,017 | $2,400 | $25,617 |
| 2021 | $625 | $24,554 | $2,400 | $22,154 |
| 2020 | $614 | $24,554 | $2,400 | $22,154 |
| 2019 | $628 | $24,406 | $2,400 | $22,006 |
| 2018 | $611 | $24,406 | $2,400 | $22,006 |
| 2017 | $819 | $27,312 | $2,400 | $24,912 |
| 2016 | $776 | $25,941 | $2,400 | $23,541 |
| 2015 | -- | $26,308 | $2,400 | $23,908 |
| 2014 | -- | $26,308 | $2,400 | $23,908 |
| 2013 | -- | $26,675 | $2,400 | $24,275 |
Source: Public Records
Map
Nearby Homes
- 74 S Lancelot St
- 93 Arnall Blvd
- 96 Jesse Johnson Dr
- 187 Evergreen Ave
- 2019 S Main St
- 600 Chattahoochee Ave
- 00 Garden Dr
- 76 S Jefferson Ave
- 556 Flowers Dr
- 337 College St
- 73 Grove Place
- 439 S Flowers Dr
- 21179 Lucile Rd
- 0080012 Old Lucile Rd
- 829 Flowers Dr
- 8 Lots Unknown Ln
- 934 Southside Dr
- 203 Willow Glen Dr
- 21 E Railroad Ln
- 0 Dasaree Ln Unit 10683861
- 30 S Lancelot St
- 18400 E South Blvd
- 44 S Lancelot St
- 9 S Lancelot St
- 18461 E South Blvd
- 58 S Lancelot St
- 18366 E South Blvd
- 238 Weaver Dr
- 47 S Lancelot St
- 18499 E South Blvd
- 214 Weaver Dr
- 77 S Lancelot St
- 198 Weaver Dr
- 18420 E South Blvd Unit 18
- 104 S Lancelot St
- 18513 E South Blvd
- 101 S Lancelot St
- 215 Weaver Dr
- 18306 E South Blvd
- 91 Hobbs St
Your Personal Tour Guide
Ask me questions while you tour the home.