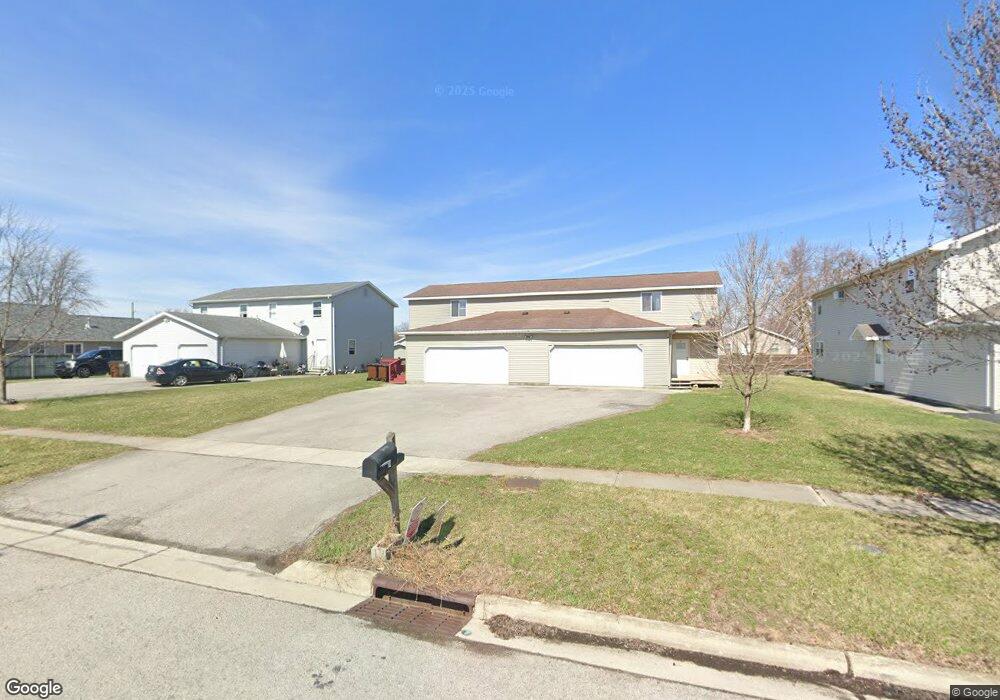
1842 Bliss Ave Unit 4 Findlay, OH 45840
Estimated Value: $193,316 - $217,000
6
Beds
4
Baths
2,688
Sq Ft
$77/Sq Ft
Est. Value
About This Home
This home is located at 1842 Bliss Ave Unit 4, Findlay, OH 45840 and is currently estimated at $207,079, approximately $77 per square foot. 1842 Bliss Ave Unit 4 is a home located in Hancock County with nearby schools including Chamberlin Hill Elementary School, Jefferson Elementary School, and Donnell Middle School.
Ownership History
Date
Name
Owned For
Owner Type
Purchase Details
Closed on
Mar 6, 2015
Sold by
Greene Zachary M
Bought by
Cunningham Randy L
Current Estimated Value
Home Financials for this Owner
Home Financials are based on the most recent Mortgage that was taken out on this home.
Original Mortgage
$105,000
Outstanding Balance
$80,301
Interest Rate
3.64%
Mortgage Type
Future Advance Clause Open End Mortgage
Estimated Equity
$126,778
Purchase Details
Closed on
Sep 17, 2010
Sold by
The Old Fort Banking Company
Bought by
Greene Zachary M
Home Financials for this Owner
Home Financials are based on the most recent Mortgage that was taken out on this home.
Original Mortgage
$83,845
Interest Rate
4.25%
Mortgage Type
FHA
Purchase Details
Closed on
Apr 27, 2010
Sold by
Miller Matthew C
Bought by
The Old Fort Banking Company
Create a Home Valuation Report for This Property
The Home Valuation Report is an in-depth analysis detailing your home's value as well as a comparison with similar homes in the area
Home Values in the Area
Average Home Value in this Area
Purchase History
| Date | Buyer | Sale Price | Title Company |
|---|---|---|---|
| Cunningham Randy L | $105,000 | Mid Am Title Agency | |
| Greene Zachary M | $85,000 | None Available | |
| The Old Fort Banking Company | $53,334 | None Available |
Source: Public Records
Mortgage History
| Date | Status | Borrower | Loan Amount |
|---|---|---|---|
| Open | Cunningham Randy L | $105,000 | |
| Previous Owner | Greene Zachary M | $83,845 |
Source: Public Records
Tax History Compared to Growth
Tax History
| Year | Tax Paid | Tax Assessment Tax Assessment Total Assessment is a certain percentage of the fair market value that is determined by local assessors to be the total taxable value of land and additions on the property. | Land | Improvement |
|---|---|---|---|---|
| 2024 | $1,643 | $45,060 | $5,800 | $39,260 |
| 2023 | $1,645 | $45,060 | $5,800 | $39,260 |
| 2022 | $1,640 | $45,060 | $5,800 | $39,260 |
| 2021 | $1,726 | $41,330 | $5,990 | $35,340 |
| 2020 | $1,726 | $41,330 | $5,990 | $35,340 |
| 2019 | $1,692 | $41,330 | $5,990 | $35,340 |
| 2018 | $1,480 | $33,170 | $5,990 | $27,180 |
| 2017 | $1,481 | $33,170 | $5,990 | $27,180 |
| 2016 | $1,468 | $33,170 | $5,990 | $27,180 |
| 2015 | $1,620 | $36,010 | $6,980 | $29,030 |
| 2014 | $1,597 | $36,010 | $6,980 | $29,030 |
| 2012 | $2,757 | $61,750 | $6,980 | $54,770 |
Source: Public Records
Map
Nearby Homes
- 0 Bushwillow Dr Unit Lot 156
- 0 Bushwillow Dr Unit Lot 155
- 0 Bushwillow Dr Unit Lot 154
- 0 County Road 99 Lot 2 Unit 6081480
- 0 Rock Candy Rd Or Bushwillow Dr Lot 173 Unit 6079093
- 0 Rock Candy Rd Lot 171 Unit 6079088
- 0 Rock Candy Rd Lot 170 Unit 6079087
- 0 Rock Candy Rd Lot 168 Unit 6079085
- 0 Bearcat Way Or 0 Rock Candy Rd Lot 167 Unit 6079083
- 0 Rock Candy Rd Lot 162 Unit 6079070
- 0 Rock Candy Rd Lot 159 Unit 6079053
- 0 Bushwillow Dr Or Rock Candy Rd Lot 157 Unit 6079052
- 0 Bushwillow Dr Lot 156 Unit 6079046
- 0 Bushwillow Dr Lot 155 Unit 6079044
- 0 Bushwillow Dr Lot 154 Unit 6079043
- 1609 Foraker Ave
- 0 Waterford Way Lot 78 Unit 6089639
- 10601 County Road 9
- 9653 Early Dr
- 9307 Hiegel Dr