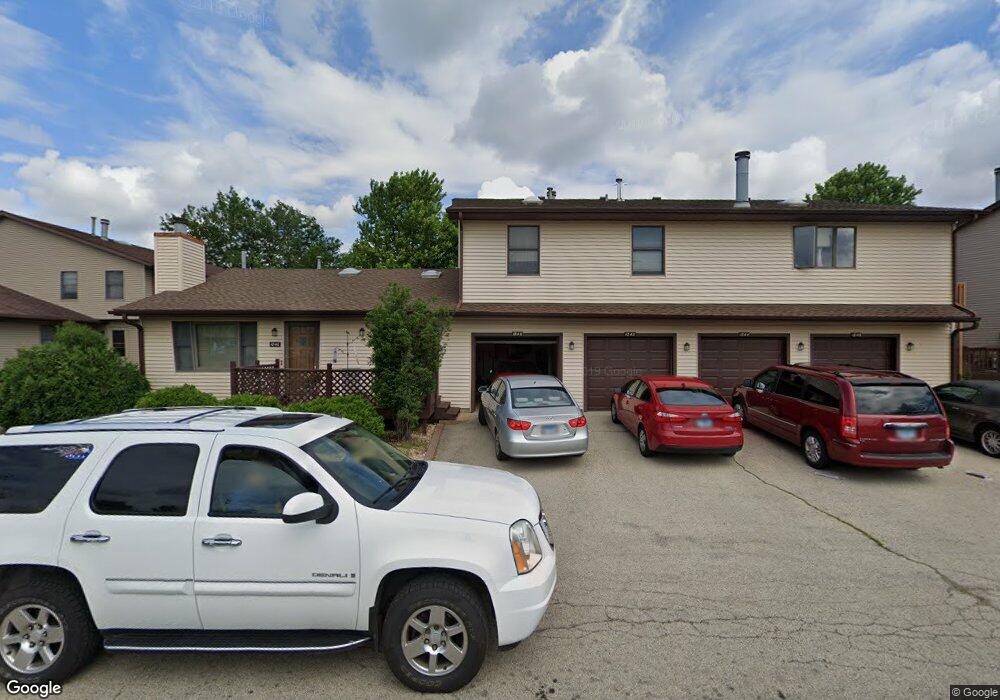
1842 Kerrybrook Ct Sycamore, IL 60178
Estimated Value: $182,000 - $191,000
--
Bed
--
Bath
--
Sq Ft
915
Sq Ft Lot
About This Home
This home is located at 1842 Kerrybrook Ct, Sycamore, IL 60178 and is currently estimated at $187,460. 1842 Kerrybrook Ct is a home located in DeKalb County with nearby schools including Sycamore High School, Cornerstone Christian Academy, and St Mary's Catholic School.
Ownership History
Date
Name
Owned For
Owner Type
Purchase Details
Closed on
Mar 1, 2021
Sold by
Deball Samantha Jo and Deball Aaron Michael
Bought by
Phillips Georgia and Phillips Tommy
Current Estimated Value
Home Financials for this Owner
Home Financials are based on the most recent Mortgage that was taken out on this home.
Original Mortgage
$117,727
Outstanding Balance
$105,534
Interest Rate
2.7%
Mortgage Type
FHA
Estimated Equity
$81,926
Purchase Details
Closed on
Feb 21, 2020
Sold by
Torres Shelley L and Deball Samantha Jo
Bought by
Deball Samatha Jo and Deball Aaron Michael
Home Financials for this Owner
Home Financials are based on the most recent Mortgage that was taken out on this home.
Original Mortgage
$86,374
Interest Rate
4.87%
Mortgage Type
FHA
Purchase Details
Closed on
Dec 12, 2018
Sold by
Torres Shelly L
Bought by
Torres Shelley L and Deball Samantha Jo
Create a Home Valuation Report for This Property
The Home Valuation Report is an in-depth analysis detailing your home's value as well as a comparison with similar homes in the area
Home Values in the Area
Average Home Value in this Area
Purchase History
| Date | Buyer | Sale Price | Title Company |
|---|---|---|---|
| Phillips Georgia | $120,000 | Attorneys Ttl Guaranty Fund | |
| Deball Samatha Jo | -- | None Available | |
| Torres Shelley L | -- | None Available |
Source: Public Records
Mortgage History
| Date | Status | Borrower | Loan Amount |
|---|---|---|---|
| Open | Phillips Georgia | $117,727 | |
| Previous Owner | Deball Samatha Jo | $86,374 |
Source: Public Records
Tax History Compared to Growth
Tax History
| Year | Tax Paid | Tax Assessment Tax Assessment Total Assessment is a certain percentage of the fair market value that is determined by local assessors to be the total taxable value of land and additions on the property. | Land | Improvement |
|---|---|---|---|---|
| 2024 | $3,266 | $48,482 | $1,772 | $46,710 |
| 2023 | $3,266 | $42,272 | $1,545 | $40,727 |
| 2022 | $3,076 | $38,594 | $1,411 | $37,183 |
| 2021 | $2,899 | $36,197 | $1,323 | $34,874 |
| 2020 | $2,883 | $35,620 | $1,302 | $34,318 |
| 2019 | $2,768 | $34,221 | $1,251 | $32,970 |
| 2018 | $2,699 | $33,061 | $1,209 | $31,852 |
| 2017 | $2,619 | $31,780 | $1,162 | $30,618 |
| 2016 | $2,602 | $30,978 | $1,133 | $29,845 |
| 2015 | -- | $29,352 | $1,074 | $28,278 |
| 2014 | -- | $29,594 | $1,554 | $28,040 |
| 2013 | -- | $31,086 | $1,632 | $29,454 |
Source: Public Records
Map
Nearby Homes
- 2123 Fairland Dr
- 1729 Raintree Ct Unit 92
- 1721 Cedarbrook Ct Unit 1
- Lots 700-900 Ridge Dr
- 0000 Coltonville Rd
- Lots 1 & 2 Dekalb Ave
- 1606 E Stonehenge Dr
- Lot 7 Aberdeen Ct
- Lot 104 Aberdeen Ct
- 1235 Hathaway Dr
- 1208 Foxpointe Dr
- Lot 4 W Prairie Dr
- 625 Anjali Ct Unit L
- 617 Anjali Ct
- 932 Foxpointe Dr
- 610 Anjali Ct Unit R
- 608 Anjali Ct Unit L
- 505 Anjali Ct
- Lot 49 Peace Rd
- Lot 31 Aster Rd
- 1842 Kerrybrook Ct Unit 2
- 1865 Kerrybrook Ct
- 1863 Kerrybrook Ct
- 1840 Kerrybrook Ct
- 1844 Kerrybrook Ct
- 1861 Kerrybrook Ct
- 1869 Kerrybrook Ct
- 1859 Kerrybrook Ct
- 1838 Kerrybrook Ct
- 1846 Kerrybrook Ct
- 1871 Kerrybrook Ct
- 1846 Kerrybrook Ct Unit 1846
- 1857 Kerrybrook Ct
- 1836 Kerrybrook Ct
- 1855 Kerrybrook Ct
- 1851 Kerrybrook Ct
- 1853 Kerrybrook Ct
- 1834 Kerrybrook Ct
- 1834 Kerrybrook Ct Unit 2
- 1832 Kerrybrook Ct