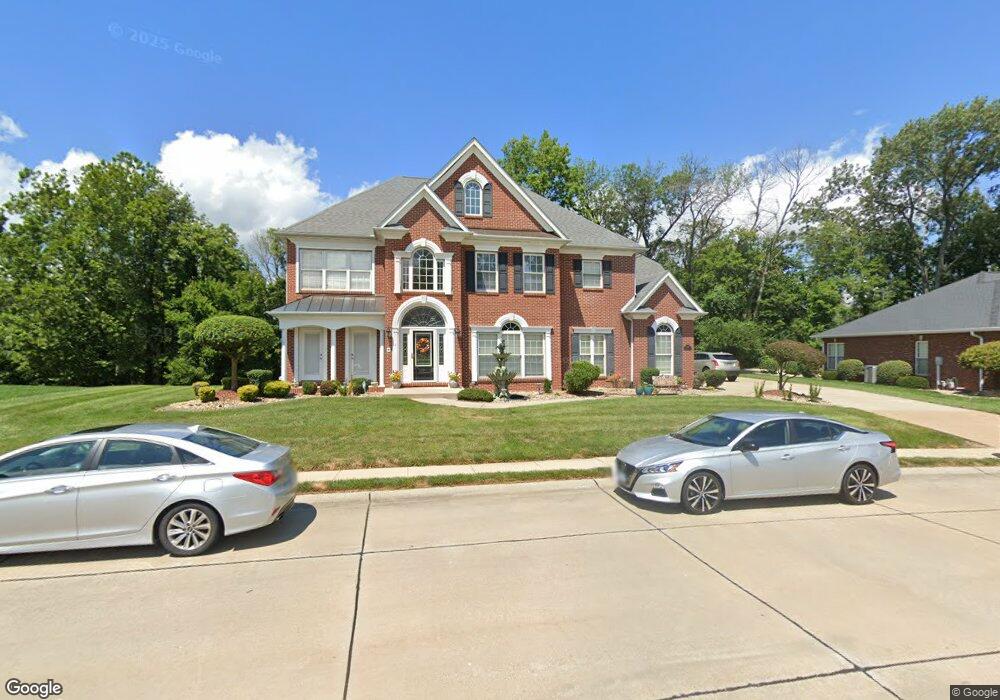
1842 Riviera Ln O Fallon, IL 62269
Estimated Value: $512,267 - $605,000
5
Beds
5
Baths
3,412
Sq Ft
$166/Sq Ft
Est. Value
About This Home
This home is located at 1842 Riviera Ln, O Fallon, IL 62269 and is currently estimated at $567,817, approximately $166 per square foot. 1842 Riviera Ln is a home located in St. Clair County with nearby schools including Moye Elementary School, Fulton Junior High School, and O'Fallon Township High School.
Ownership History
Date
Name
Owned For
Owner Type
Purchase Details
Closed on
Jun 29, 2010
Sold by
Ritter Dow V
Bought by
Novack Robert J
Current Estimated Value
Home Financials for this Owner
Home Financials are based on the most recent Mortgage that was taken out on this home.
Original Mortgage
$304,000
Interest Rate
5.4%
Mortgage Type
Purchase Money Mortgage
Purchase Details
Closed on
Oct 1, 2009
Sold by
Ritter Todd M
Bought by
Ritter Dow V
Purchase Details
Closed on
Jan 31, 2005
Sold by
Forest Hills Development Co Llc
Bought by
Ritter Todd M and Ritter Dow V
Home Financials for this Owner
Home Financials are based on the most recent Mortgage that was taken out on this home.
Original Mortgage
$370,200
Interest Rate
5.79%
Mortgage Type
Purchase Money Mortgage
Purchase Details
Closed on
Jun 9, 2003
Sold by
Forest Hills Development Co Llc
Bought by
West John W and John W West Revocable Trust
Create a Home Valuation Report for This Property
The Home Valuation Report is an in-depth analysis detailing your home's value as well as a comparison with similar homes in the area
Home Values in the Area
Average Home Value in this Area
Purchase History
| Date | Buyer | Sale Price | Title Company |
|---|---|---|---|
| Novack Robert J | $380,000 | Advanced Title Solutions Inc | |
| Ritter Dow V | -- | None Available | |
| Ritter Todd M | $436,000 | Fleming Title Company | |
| West John W | -- | Fleming Title Company |
Source: Public Records
Mortgage History
| Date | Status | Borrower | Loan Amount |
|---|---|---|---|
| Closed | Novack Robert J | $304,000 | |
| Previous Owner | Ritter Todd M | $370,200 |
Source: Public Records
Tax History Compared to Growth
Tax History
| Year | Tax Paid | Tax Assessment Tax Assessment Total Assessment is a certain percentage of the fair market value that is determined by local assessors to be the total taxable value of land and additions on the property. | Land | Improvement |
|---|---|---|---|---|
| 2024 | $11,824 | $168,204 | $27,318 | $140,886 |
| 2023 | $10,856 | $149,289 | $24,246 | $125,043 |
| 2022 | $10,229 | $137,252 | $22,291 | $114,961 |
| 2021 | $9,630 | $127,294 | $22,363 | $104,931 |
| 2020 | $9,555 | $120,496 | $21,169 | $99,327 |
| 2019 | $9,333 | $120,496 | $21,169 | $99,327 |
| 2018 | $9,079 | $116,997 | $20,554 | $96,443 |
| 2017 | $9,322 | $115,822 | $21,494 | $94,328 |
| 2016 | $9,291 | $113,118 | $20,992 | $92,126 |
| 2014 | $8,589 | $111,810 | $20,749 | $91,061 |
| 2013 | $8,289 | $108,196 | $20,431 | $87,765 |
Source: Public Records
Map
Nearby Homes
- 1845 Riviera Ln
- 1830 Riviera Ln
- 109 Callaway Ct
- 213 Hodgens Mill Ln
- 157 Knob Creek Ln
- 1588 Turn Creek Ct
- 1676 Lancaster Dr
- 1551 N Parc Grove Ct
- 108 Chickasaw Ln
- 500 Lake Vista Way
- 1183 Tazewell Dr
- 323 Moultrie Ln
- 1356 Dove Hollow Cir
- 536 Mercer Ct
- 1217 Usher Dr
- 1221 Seward Dr
- 1509 Cedar Ridge Dr
- 1171 Red Hawk Ridge Ln
- 1342 Stone Creek Dr
- 1217 Dempcy Ln
- 1846 Riviera Ln
- 1841 Riviera Ln
- 1834 Riviera Ln
- 1837 Riviera Ln
- 1850 Riviera Ln
- 125 Bethel Rd
- 1833 Riviera Ln
- 1849 Riviera Ln
- 149 Bethel Rd
- 149 Bethel Rd
- 1827 Riviera Ln
- 1826 Riviera Ln
- 1821 Riviera Ln
- 1822 Riviera Ln
- 134 Bethel Rd
- 1817 Riviera Ln
- 1816 Riviera Ln
- 1813 Riviera Ln
- 1812 Riviera Ln
- 148 Bethel Rd