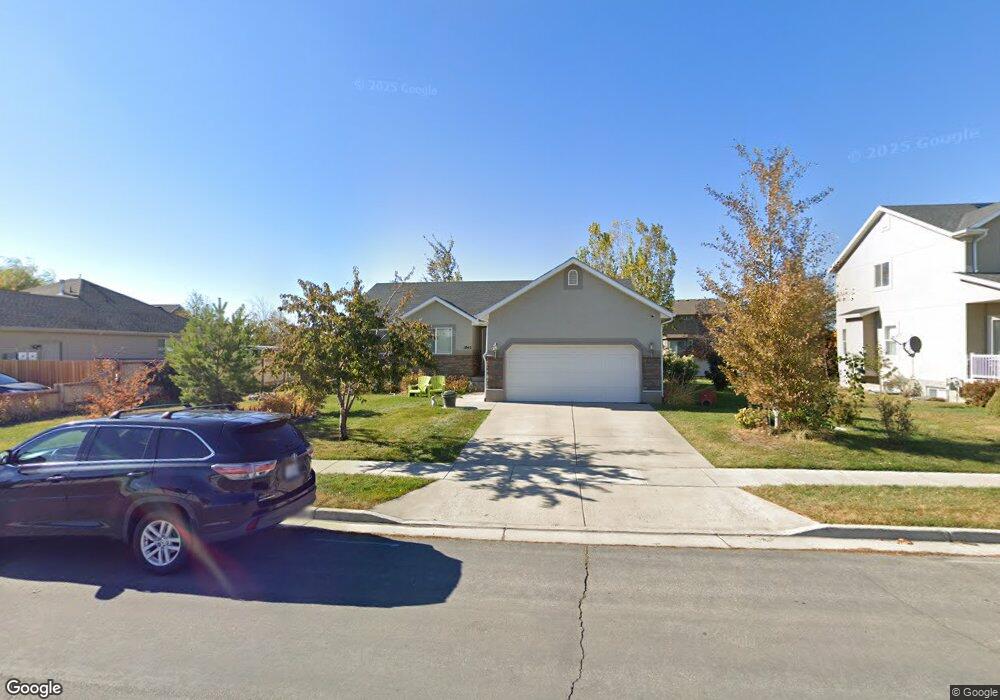
1842 S 2350 W Syracuse, UT 84075
Estimated Value: $505,000 - $538,006
3
Beds
3
Baths
2,810
Sq Ft
$187/Sq Ft
Est. Value
About This Home
This home is located at 1842 S 2350 W, Syracuse, UT 84075 and is currently estimated at $525,752, approximately $187 per square foot. 1842 S 2350 W is a home located in Davis County with nearby schools including Syracuse Elementary School, Syracuse Junior High School, and Syracuse High School.
Ownership History
Date
Name
Owned For
Owner Type
Purchase Details
Closed on
Apr 29, 2014
Sold by
Lau Alfred L and Lau Hoon P
Bought by
Usle Michael L and Usle Melekoula M
Current Estimated Value
Home Financials for this Owner
Home Financials are based on the most recent Mortgage that was taken out on this home.
Original Mortgage
$199,192
Outstanding Balance
$151,080
Interest Rate
4.28%
Mortgage Type
VA
Estimated Equity
$374,672
Purchase Details
Closed on
Dec 13, 2005
Sold by
Benchmark Real Estate Co
Bought by
Lau Alfred L and Lau Hoon P
Home Financials for this Owner
Home Financials are based on the most recent Mortgage that was taken out on this home.
Original Mortgage
$51,525
Interest Rate
5.86%
Mortgage Type
Stand Alone Second
Create a Home Valuation Report for This Property
The Home Valuation Report is an in-depth analysis detailing your home's value as well as a comparison with similar homes in the area
Home Values in the Area
Average Home Value in this Area
Purchase History
| Date | Buyer | Sale Price | Title Company |
|---|---|---|---|
| Usle Michael L | -- | Founders Title Co La | |
| Lau Alfred L | -- | Founders Title Company |
Source: Public Records
Mortgage History
| Date | Status | Borrower | Loan Amount |
|---|---|---|---|
| Open | Usle Michael L | $199,192 | |
| Previous Owner | Lau Alfred L | $51,525 | |
| Previous Owner | Lau Alfred L | $144,270 |
Source: Public Records
Tax History Compared to Growth
Tax History
| Year | Tax Paid | Tax Assessment Tax Assessment Total Assessment is a certain percentage of the fair market value that is determined by local assessors to be the total taxable value of land and additions on the property. | Land | Improvement |
|---|---|---|---|---|
| 2025 | $2,594 | $250,250 | $125,024 | $125,226 |
| 2024 | $2,605 | $253,000 | $103,457 | $149,543 |
| 2023 | $2,441 | $432,000 | $144,152 | $287,848 |
| 2022 | $2,636 | $255,750 | $82,972 | $172,778 |
| 2021 | $2,330 | $350,000 | $122,621 | $227,379 |
| 2020 | $2,084 | $303,000 | $106,789 | $196,211 |
| 2019 | $2,041 | $293,000 | $104,414 | $188,586 |
| 2018 | $1,867 | $266,000 | $100,824 | $165,176 |
| 2016 | $1,615 | $120,670 | $38,697 | $81,973 |
| 2015 | $1,566 | $111,485 | $38,697 | $72,788 |
| 2014 | $1,523 | $110,453 | $38,697 | $71,756 |
| 2013 | -- | $110,409 | $32,571 | $77,838 |
Source: Public Records
Map
Nearby Homes
- 4344 W 1825 S Unit 102
- 4354 W 1825 S Unit 104
- 4348 W 1825 S Unit 103
- 1918 S 2465 W
- 1932 S 2150 W
- 1641 S 2350 W Unit B
- 2679 W Antelope Dr
- 2297 W 2175 S
- 2136 W 2200 S
- 2104 W 2200 S
- 2047 S 2000 W
- 2236 S 2685 W
- 2000 S 1800 W
- 2982 S 3000 W
- 2912 S 3000 W
- 2117 W 1275 S
- 2194 S 1800 W
- 2082 S 1730 W
- 2726 2495 S Unit 205
- 2655 S 2430 W Unit 120