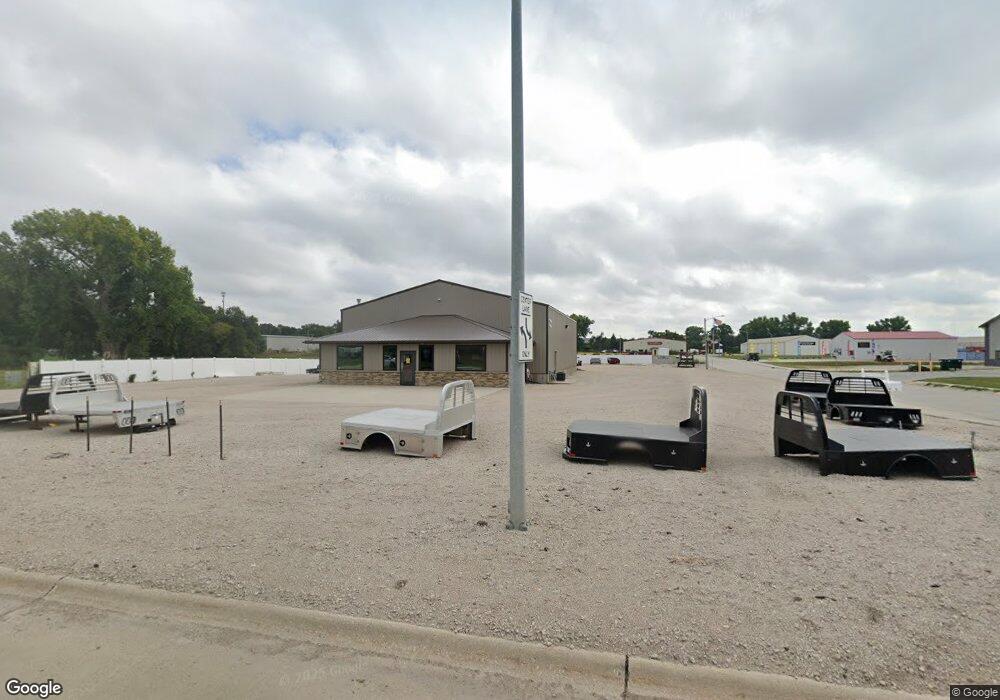
1842 S E St Broken Bow, NE 68822
Estimated Value: $74,000
Studio
--
Bath
3,200
Sq Ft
$23/Sq Ft
Est. Value
About This Home
This home is located at 1842 S E St, Broken Bow, NE 68822 and is currently priced at $74,000, approximately $23 per square foot. 1842 S E St is a home located in Custer County with nearby schools including North Park Elementary School, Broken Bow Junior High School, and Broken Bow High School.
Ownership History
Date
Name
Owned For
Owner Type
Purchase Details
Closed on
Feb 7, 2014
Sold by
Bcct Enterprises Llc
Bought by
Forrester Bruce A and Forrester Julie E
Current Estimated Value
Purchase Details
Closed on
May 6, 2013
Sold by
Hammond Brent L & Sunshine A
Bought by
Bcct Enterprises Llc
Purchase Details
Closed on
Apr 24, 2009
Sold by
Security State Bank
Bought by
Hammond Brent L & Sunshine A
Purchase Details
Closed on
Dec 22, 2008
Sold by
Switzer Donald E and Switzer Sara L
Bought by
Security State Bank
Purchase Details
Closed on
Oct 31, 2006
Sold by
Stump Lawrence and Stump Heather
Bought by
Switzer Donald and Switzer Sara
Purchase Details
Closed on
Oct 20, 2006
Sold by
Mccandless Eldon and Mccandless Connie
Bought by
Stump Lawrence and Stump Heather
Purchase Details
Closed on
Jan 19, 2006
Sold by
Mccandless Eldon and Mccandless Connie
Bought by
Mccandless Eldon and Mccandless Connie
Create a Home Valuation Report for This Property
The Home Valuation Report is an in-depth analysis detailing your home's value as well as a comparison with similar homes in the area
Home Values in the Area
Average Home Value in this Area
Purchase History
| Date | Buyer | Sale Price | Title Company |
|---|---|---|---|
| Forrester Bruce A | $120,000 | -- | |
| Bcct Enterprises Llc | $80,000 | -- | |
| Hammond Brent L & Sunshine A | $70,000 | -- | |
| Security State Bank | -- | -- | |
| Switzer Donald | $67,000 | -- | |
| Stump Lawrence | $60,000 | -- | |
| Mccandless Eldon | $60,000 | -- |
Source: Public Records
Tax History
| Year | Tax Paid | Tax Assessment Tax Assessment Total Assessment is a certain percentage of the fair market value that is determined by local assessors to be the total taxable value of land and additions on the property. | Land | Improvement |
|---|---|---|---|---|
| 2025 | $3,632 | $284,401 | $91,080 | $193,321 |
| 2024 | $3,835 | $284,401 | $91,080 | $193,321 |
| 2023 | $4,455 | $284,401 | $91,080 | $193,321 |
| 2022 | $5,219 | $284,401 | $91,080 | $193,321 |
| 2021 | $5,808 | $323,759 | $79,200 | $244,559 |
| 2020 | $5,758 | $323,759 | $79,200 | $244,559 |
| 2019 | $5,748 | $323,759 | $79,200 | $244,559 |
| 2017 | $5,912 | $323,759 | $79,200 | $244,559 |
| 2016 | $6,469 | $323,759 | $79,200 | $244,559 |
| 2015 | $1,544 | $289,175 | $44,616 | $244,559 |
| 2014 | $1,544 | $69,661 | $10,032 | $59,629 |
Source: Public Records
Map
Nearby Homes
Your Personal Tour Guide
Ask me questions while you tour the home.