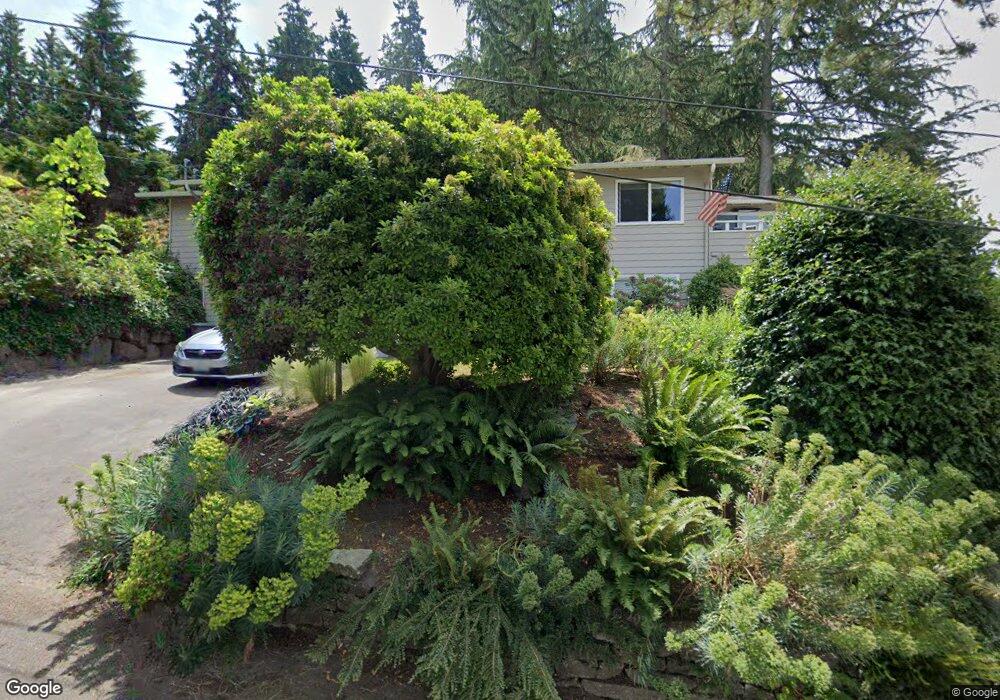
18423 High St Edmonds, WA 98020
Perrinville - Seaview NeighborhoodEstimated Value: $1,346,191 - $1,550,000
3
Beds
3
Baths
2,600
Sq Ft
$549/Sq Ft
Est. Value
About This Home
This home is located at 18423 High St, Edmonds, WA 98020 and is currently estimated at $1,426,798, approximately $548 per square foot. 18423 High St is a home located in Snohomish County with nearby schools including Seaview Elementary School, Meadowdale Middle School, and Meadowdale High School.
Ownership History
Date
Name
Owned For
Owner Type
Purchase Details
Closed on
Apr 30, 2022
Sold by
Reynolds William J
Bought by
Safe Harbor Trust
Current Estimated Value
Purchase Details
Closed on
Apr 21, 2006
Sold by
The Mary Alys Gilchrist Revocable Trust and Gilchrist Mary Alys
Bought by
Reynolds William J and Reynolds Maxine A
Home Financials for this Owner
Home Financials are based on the most recent Mortgage that was taken out on this home.
Original Mortgage
$65,000
Interest Rate
6.29%
Mortgage Type
Credit Line Revolving
Purchase Details
Closed on
Nov 10, 2005
Sold by
Shovell William L and Shovell Mildred K
Bought by
Mary Alyse Gilchrist Revocable Trust
Home Financials for this Owner
Home Financials are based on the most recent Mortgage that was taken out on this home.
Original Mortgage
$117,000
Interest Rate
5.93%
Mortgage Type
Fannie Mae Freddie Mac
Create a Home Valuation Report for This Property
The Home Valuation Report is an in-depth analysis detailing your home's value as well as a comparison with similar homes in the area
Home Values in the Area
Average Home Value in this Area
Purchase History
| Date | Buyer | Sale Price | Title Company |
|---|---|---|---|
| Safe Harbor Trust | -- | -- | |
| Reynolds William J | $600,000 | Pnwt | |
| Mary Alyse Gilchrist Revocable Trust | $424,000 | First American Title Ins Co |
Source: Public Records
Mortgage History
| Date | Status | Borrower | Loan Amount |
|---|---|---|---|
| Previous Owner | Reynolds William J | $65,000 | |
| Previous Owner | Reynolds William J | $415,000 | |
| Previous Owner | Mary Alyse Gilchrist Revocable Trust | $117,000 |
Source: Public Records
Tax History Compared to Growth
Tax History
| Year | Tax Paid | Tax Assessment Tax Assessment Total Assessment is a certain percentage of the fair market value that is determined by local assessors to be the total taxable value of land and additions on the property. | Land | Improvement |
|---|---|---|---|---|
| 2025 | $8,260 | $1,139,000 | $807,500 | $331,500 |
| 2024 | $8,260 | $1,159,500 | $828,000 | $331,500 |
| 2023 | $7,548 | $1,097,800 | $711,600 | $386,200 |
| 2022 | $6,385 | $763,600 | $438,200 | $325,400 |
| 2020 | $5,783 | $618,400 | $393,800 | $224,600 |
| 2019 | $5,626 | $606,100 | $384,000 | $222,100 |
| 2018 | $5,984 | $557,100 | $355,200 | $201,900 |
| 2017 | $5,470 | $532,900 | $351,000 | $181,900 |
| 2016 | $5,175 | $499,500 | $322,000 | $177,500 |
| 2015 | $4,937 | $448,600 | $274,000 | $174,600 |
| 2013 | $4,377 | $375,100 | $209,000 | $166,100 |
Source: Public Records
Map
Nearby Homes
- 192 XX Olympic View Dr
- 1514 9th Ave N
- 1030 Grandview St
- 19523 86th Ave W Unit 523
- 1414 9th Ave N Unit 105
- 8516 196th St SW Unit 105
- 8516 196th St SW Unit 302
- 8516 196th St SW Unit 206
- 8516 196th St SW Unit 311
- 8036 Cyrus Place
- 8001 Talbot Rd
- 8019 196th St SW Unit C4
- 7525 178th Place SW
- 8427 200th St SW
- 18312 73rd Ave W
- 157 xx 72nd Ave W
- 19718 76th Ave W Unit C
- 20126 81st Ave W
- 7469 174th St SW
- 625 Aloha Way
- 18431 High St
- 18403 High St
- 18425 High St
- 18415 High St
- 18429 High St
- 18411 High St
- 18401 High St
- 9400 183rd Place SW
- 18424 92nd Ave W
- 9228 183rd Place SW
- 9134 92nd Ave W
- 9232 183rd Place SW
- 9134 184th St SW
- 18416 High St
- 9222 183rd Place SW
- 94 XX 183rd Place SW
- 18418 High St
- 18500 High St
- 9135 184th St SW
- 9400 High St