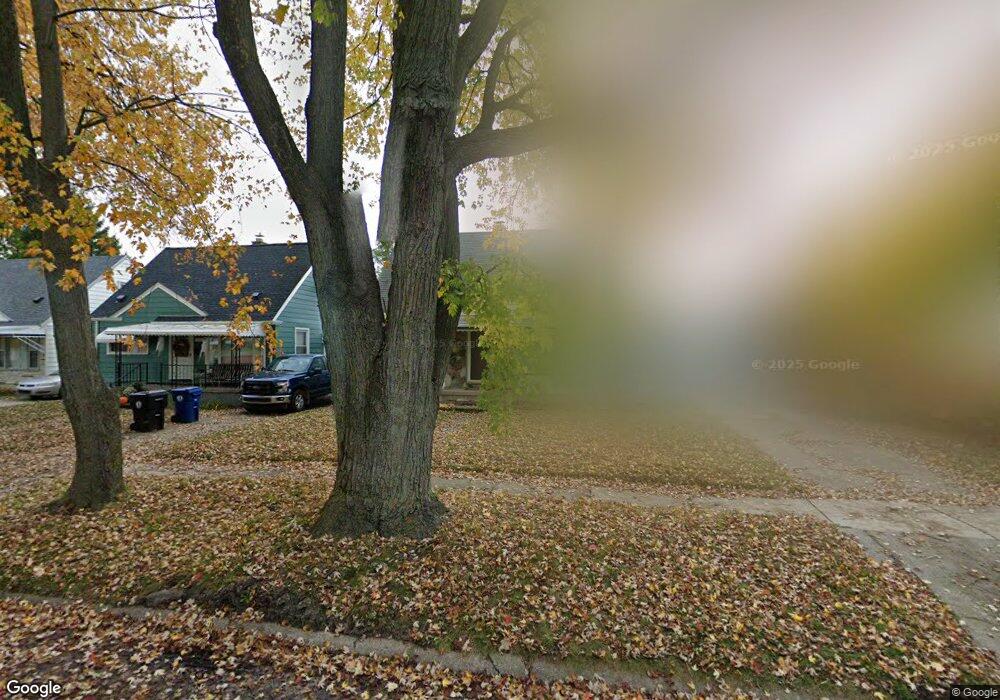
18426 Fox Redford, MI 48240
Estimated Value: $161,000 - $175,000
3
Beds
2
Baths
1,000
Sq Ft
$170/Sq Ft
Est. Value
About This Home
This home is located at 18426 Fox, Redford, MI 48240 and is currently estimated at $169,868, approximately $169 per square foot. 18426 Fox is a home located in Wayne County with nearby schools including Beech Elementary School, Hilbert Elementary School, and David Ellis Academy West.
Ownership History
Date
Name
Owned For
Owner Type
Purchase Details
Closed on
Jun 1, 2020
Sold by
Wesner Kendra D
Bought by
Wesner Steven M
Current Estimated Value
Purchase Details
Closed on
Sep 15, 2008
Sold by
Strzalkowski Richard T and Strzalkowski Dawn
Bought by
Wesner Steven M
Purchase Details
Closed on
Jul 29, 2002
Sold by
Koski Dorothy A
Bought by
Oconnor Dawn
Home Financials for this Owner
Home Financials are based on the most recent Mortgage that was taken out on this home.
Original Mortgage
$113,160
Interest Rate
6.32%
Create a Home Valuation Report for This Property
The Home Valuation Report is an in-depth analysis detailing your home's value as well as a comparison with similar homes in the area
Home Values in the Area
Average Home Value in this Area
Purchase History
| Date | Buyer | Sale Price | Title Company |
|---|---|---|---|
| Wesner Steven M | -- | None Available | |
| Wesner Steven M | $97,000 | First Centennial Title Inc | |
| Oconnor Dawn | $123,000 | -- |
Source: Public Records
Mortgage History
| Date | Status | Borrower | Loan Amount |
|---|---|---|---|
| Previous Owner | Oconnor Dawn | $113,160 |
Source: Public Records
Tax History
| Year | Tax Paid | Tax Assessment Tax Assessment Total Assessment is a certain percentage of the fair market value that is determined by local assessors to be the total taxable value of land and additions on the property. | Land | Improvement |
|---|---|---|---|---|
| 2025 | $813 | $76,300 | $0 | $0 |
| 2024 | $790 | $69,800 | $0 | $0 |
| 2023 | $715 | $59,000 | $0 | $0 |
| 2022 | $1,799 | $51,700 | $0 | $0 |
| 2021 | $1,749 | $49,300 | $0 | $0 |
| 2020 | $1,726 | $44,200 | $0 | $0 |
| 2019 | $1,689 | $37,200 | $0 | $0 |
| 2018 | $645 | $31,600 | $0 | $0 |
| 2017 | $1,664 | $29,300 | $0 | $0 |
| 2016 | $1,463 | $27,700 | $0 | $0 |
| 2015 | $2,316 | $25,200 | $0 | $0 |
| 2013 | $2,310 | $23,900 | $0 | $0 |
| 2012 | $1,588 | $27,000 | $7,800 | $19,200 |
Source: Public Records
Map
Nearby Homes
- 18743 Macarthur
- 18851 Poinciana
- 19151 Negaunee
- 18570 Pershing St
- 17722 Kinloch
- 18590 Pershing Ave
- 18411 Foch St
- 17285 Gaylord
- 17697 Norborne
- 17637 Norborne
- 18292 Deering St
- 00000 Centralia
- 26802 Vassar Ave
- 18285 Deering St
- 19366 Woodworth
- 19430 Lexington
- 19350 Antago St
- 18435 Glenmore
- 19369 Wakenden
- 19498 Poinciana