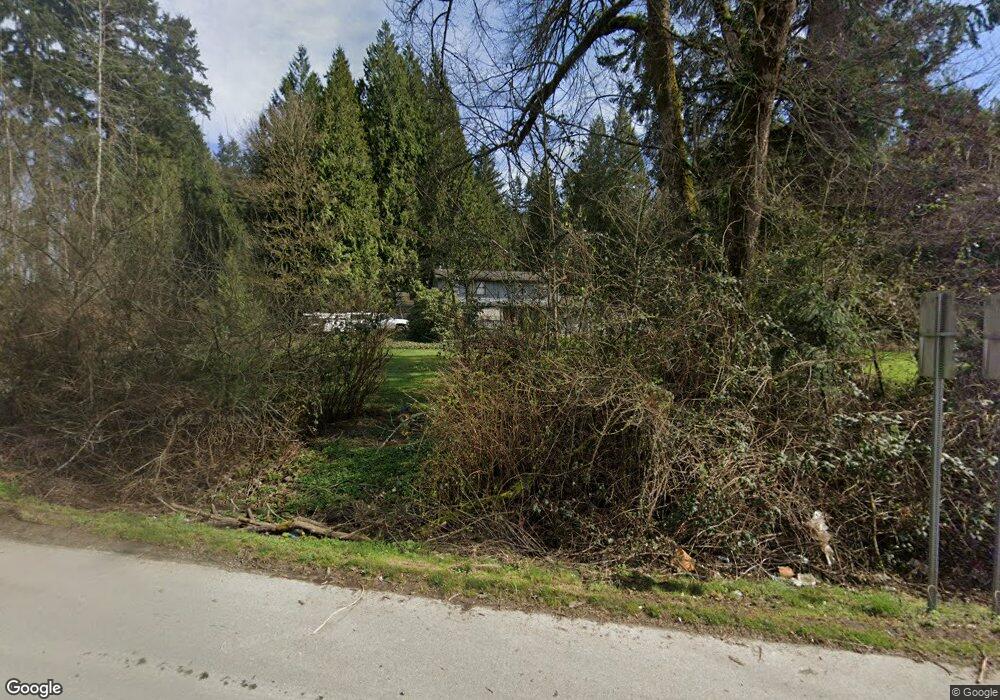
18429 State Route 9 SE Snohomish, WA 98296
Estimated Value: $805,000 - $964,000
4
Beds
4
Baths
1,920
Sq Ft
$462/Sq Ft
Est. Value
About This Home
This home is located at 18429 State Route 9 SE, Snohomish, WA 98296 and is currently estimated at $887,546, approximately $462 per square foot. 18429 State Route 9 SE is a home located in Snohomish County with nearby schools including Cathcart Elementary School, Valley View Middle School, and Glacier Peak High School.
Ownership History
Date
Name
Owned For
Owner Type
Purchase Details
Closed on
Apr 4, 2010
Sold by
Kaylor Joseph and Kaylor Jennifer
Bought by
State Of Washington Department Of Transp
Current Estimated Value
Purchase Details
Closed on
Mar 1, 2000
Sold by
Hastings Anne S
Bought by
Kaylor Joseph L and Kaylor Jennifer L
Home Financials for this Owner
Home Financials are based on the most recent Mortgage that was taken out on this home.
Original Mortgage
$234,070
Interest Rate
8.26%
Mortgage Type
FHA
Purchase Details
Closed on
Apr 2, 1997
Sold by
Williams Jeffrey C
Bought by
Kaylor Joseph and Kaylor Jennifer
Home Financials for this Owner
Home Financials are based on the most recent Mortgage that was taken out on this home.
Original Mortgage
$170,808
Interest Rate
7.56%
Mortgage Type
FHA
Create a Home Valuation Report for This Property
The Home Valuation Report is an in-depth analysis detailing your home's value as well as a comparison with similar homes in the area
Home Values in the Area
Average Home Value in this Area
Purchase History
| Date | Buyer | Sale Price | Title Company |
|---|---|---|---|
| State Of Washington Department Of Transp | $56,179 | Pnwt | |
| Kaylor Joseph L | $236,000 | -- | |
| Kaylor Joseph | $174,650 | -- |
Source: Public Records
Mortgage History
| Date | Status | Borrower | Loan Amount |
|---|---|---|---|
| Previous Owner | Kaylor Joseph L | $234,070 | |
| Previous Owner | Kaylor Joseph | $170,808 |
Source: Public Records
Tax History Compared to Growth
Tax History
| Year | Tax Paid | Tax Assessment Tax Assessment Total Assessment is a certain percentage of the fair market value that is determined by local assessors to be the total taxable value of land and additions on the property. | Land | Improvement |
|---|---|---|---|---|
| 2025 | $6,867 | $696,300 | $458,300 | $238,000 |
| 2024 | $6,867 | $665,300 | $446,100 | $219,200 |
| 2023 | $7,230 | $782,700 | $539,000 | $243,700 |
| 2022 | $6,952 | $603,800 | $353,300 | $250,500 |
| 2020 | $5,986 | $490,100 | $291,100 | $199,000 |
| 2019 | $5,433 | $441,400 | $262,100 | $179,300 |
| 2018 | $6,089 | $412,600 | $241,000 | $171,600 |
| 2017 | $4,960 | $342,700 | $182,700 | $160,000 |
| 2016 | $4,876 | $324,900 | $176,000 | $148,900 |
| 2015 | $4,808 | $307,500 | $159,000 | $148,500 |
| 2013 | $3,475 | $210,800 | $127,800 | $83,000 |
Source: Public Records
Map
Nearby Homes
- 18016 Snohomish Ave
- 6907 184th St SE
- 3030 183rd St SE
- 17317 Interurban Blvd
- 16429 Snohomish Ave
- 7029 205th St SE
- 20524 73rd Dr SE
- 20717 78th Ave SE
- 16031 State Route 9 SE
- 8109 130th Place SE Unit 59
- 8109 130th Place SE
- 19007 Yew Way
- 15919 68th Ave SE
- 18612 51st Ave SE
- 16432 57th Ave SE
- 10101 Elliott Rd
- 7331 156th St SE
- 0 212th St SE Unit NWM2389012
- 4612 186th Place SE Unit A
- 4714 175th St SE
- 18302 Washington 9
- 18425 Washington 9
- 18425 State Route 9 SE
- 18417 State Route 9 SE
- 18421 State Route 9 SE
- 18432 State Route 9 SE
- 18410 State Route 9 SE
- 18504 Sr 9 SE
- 18504 Washington 9
- 18504 State Route 9 SE
- 18621 Sr 9 SE
- 7916 184th St SE
- 18431 Snohomish Ave
- 18621 State Route 9 SE
- 18423 Snohomish Ave
- 18509 Snohomish Ave
- 18228 State Route 9 SE
- 7709 188th St SE Unit 237
- 7709 188th St SE
- 8107 188th St SE