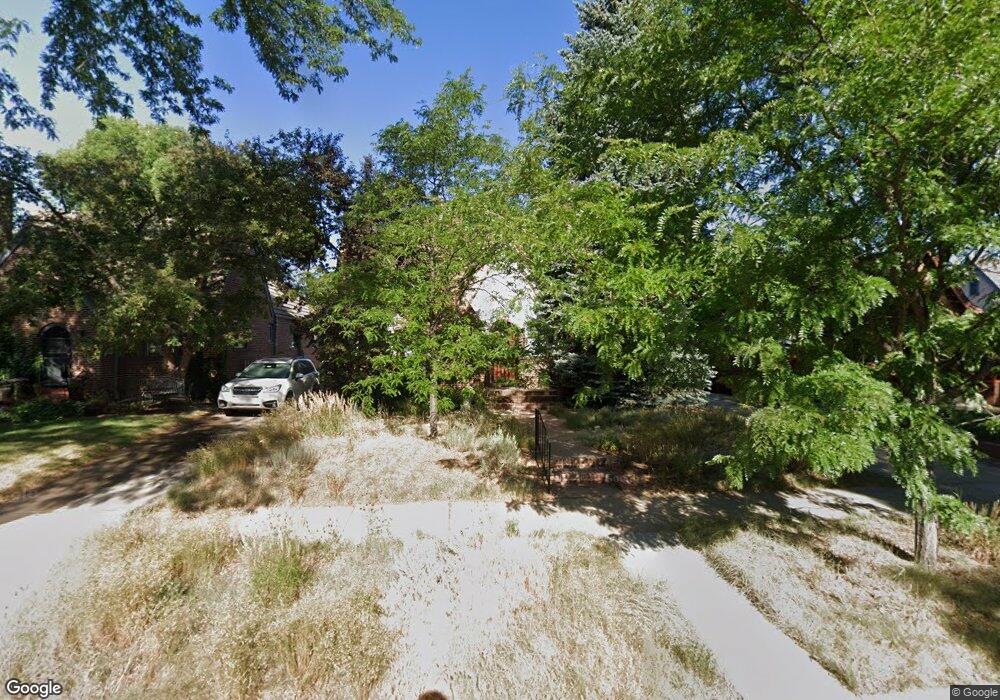
1843 Cherry St Denver, CO 80220
South Park Hill NeighborhoodEstimated Value: $851,000 - $1,512,000
3
Beds
2
Baths
2,727
Sq Ft
$401/Sq Ft
Est. Value
About This Home
This home is located at 1843 Cherry St, Denver, CO 80220 and is currently estimated at $1,092,360, approximately $400 per square foot. 1843 Cherry St is a home located in Denver County with nearby schools including Park Hill Elementary, William (Bill) Roberts ECE-8 School, and McAuliffe International School.
Ownership History
Date
Name
Owned For
Owner Type
Purchase Details
Closed on
Nov 19, 2010
Sold by
Sharp John Burton and Sharp Nancy L
Bought by
Weil Timothy R and Weil Nancy B
Current Estimated Value
Home Financials for this Owner
Home Financials are based on the most recent Mortgage that was taken out on this home.
Original Mortgage
$150,000
Interest Rate
4.27%
Mortgage Type
New Conventional
Purchase Details
Closed on
May 22, 2007
Sold by
The Sharp Family Trust
Bought by
Sharp John Burton and Sharp Nancy L
Purchase Details
Closed on
May 11, 2004
Sold by
Primacy Closing Corp
Bought by
The Sharp Family Trust
Purchase Details
Closed on
Oct 4, 1994
Sold by
Lutz Denise
Bought by
Bell Katherine E
Home Financials for this Owner
Home Financials are based on the most recent Mortgage that was taken out on this home.
Original Mortgage
$130,000
Interest Rate
8.5%
Create a Home Valuation Report for This Property
The Home Valuation Report is an in-depth analysis detailing your home's value as well as a comparison with similar homes in the area
Home Values in the Area
Average Home Value in this Area
Purchase History
| Date | Buyer | Sale Price | Title Company |
|---|---|---|---|
| Weil Timothy R | $488,000 | None Available | |
| Sharp John Burton | -- | None Available | |
| The Sharp Family Trust | $449,000 | Land Title | |
| Primacy Closing Corp | $449,000 | Land Title | |
| Bell Katherine E | $170,000 | -- |
Source: Public Records
Mortgage History
| Date | Status | Borrower | Loan Amount |
|---|---|---|---|
| Closed | Weil Timothy R | $150,000 | |
| Previous Owner | Bell Katherine E | $130,000 |
Source: Public Records
Tax History
| Year | Tax Paid | Tax Assessment Tax Assessment Total Assessment is a certain percentage of the fair market value that is determined by local assessors to be the total taxable value of land and additions on the property. | Land | Improvement |
|---|---|---|---|---|
| 2025 | $4,926 | $73,980 | $36,820 | $36,820 |
| 2024 | $4,926 | $62,190 | $29,470 | $32,720 |
| 2023 | $4,819 | $62,190 | $29,470 | $32,720 |
| 2022 | $4,618 | $58,070 | $30,570 | $27,500 |
| 2021 | $4,458 | $59,740 | $31,450 | $28,290 |
| 2020 | $4,661 | $62,820 | $29,480 | $33,340 |
| 2019 | $4,530 | $62,820 | $29,480 | $33,340 |
| 2018 | $3,730 | $48,210 | $19,790 | $28,420 |
| 2017 | $3,719 | $48,210 | $19,790 | $28,420 |
| 2016 | $3,531 | $43,300 | $21,882 | $21,418 |
| 2015 | $3,383 | $43,300 | $21,882 | $21,418 |
| 2014 | $3,215 | $38,710 | $13,126 | $25,584 |
Source: Public Records
Map
Nearby Homes
- 4535 E Montview Blvd
- 1150-60 N Dahlia St
- 1160 N Dahlia St
- 1727 Dahlia St
- 4621 E 17th Avenue Pkwy
- 1827 Bellaire St
- 2025 Eudora St
- 1751 Bellaire St
- 1699 Bellaire St
- 4101 E 17th Avenue Pkwy Unit 4105
- 4037 E 17th Avenue Pkwy
- 2209 Ash St
- 4033 E 17th Avenue Pkwy
- 1575 Eudora St
- 2314 Dexter St
- 1510 Clermont St
- 1684 Harrison St Unit 8
- 1620 Colorado Blvd Unit 11
- 1620 Colorado Blvd Unit 6
- 1554 Fairfax St
- 1835 Cherry St
- 1849 Cherry St
- 1825 Cherry St
- 1855 Cherry St
- 4540 E 19th Ave
- 1819 Cherry St
- 4530 E 19th Ave
- 1840 Cherry St
- 1884 Cherry St
- 1830 Cherry St
- 1836 Cherry St
- 1811 Cherry St
- 1890 Cherry St
- 1901 Cherry St
- 1812 Cherry St
- 4526 E 19th Ave
- 4541 E 18th Ave
- 4541 E 18th Ave
- 1805 Cherry St
- 4539 E 19th Ave
Your Personal Tour Guide
Ask me questions while you tour the home.