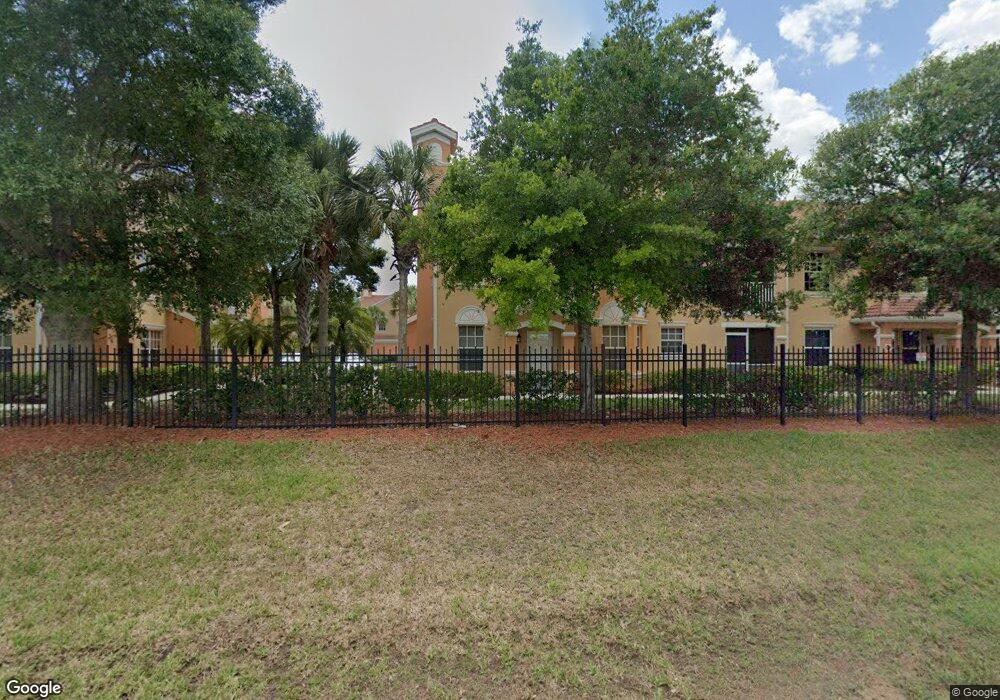
1843 Concordia Lake Cir Unit 1009 Cape Coral, FL 33909
Diplomat NeighborhoodEstimated Value: $173,000 - $232,000
2
Beds
2
Baths
1,190
Sq Ft
$170/Sq Ft
Est. Value
About This Home
This home is located at 1843 Concordia Lake Cir Unit 1009, Cape Coral, FL 33909 and is currently estimated at $201,945, approximately $169 per square foot. 1843 Concordia Lake Cir Unit 1009 is a home located in Lee County with nearby schools including Dr. Carrie D. Robinson Littleton Elementary School, Caloosa Elementary School, and Tropic Isles Elementary School.
Ownership History
Date
Name
Owned For
Owner Type
Purchase Details
Closed on
Aug 4, 2023
Sold by
Shock Kevin Owen and Shock Julie Ann
Bought by
Merritt Laura
Current Estimated Value
Home Financials for this Owner
Home Financials are based on the most recent Mortgage that was taken out on this home.
Original Mortgage
$225,000
Outstanding Balance
$219,738
Interest Rate
6.67%
Mortgage Type
New Conventional
Estimated Equity
-$17,793
Purchase Details
Closed on
Jan 15, 2021
Sold by
Monaco William John
Bought by
Shock Kevin Owen and Shock Julie Ann
Purchase Details
Closed on
Mar 28, 2007
Sold by
Concordia Cape Coral Llc
Bought by
Monaco William
Home Financials for this Owner
Home Financials are based on the most recent Mortgage that was taken out on this home.
Original Mortgage
$169,900
Interest Rate
6.25%
Mortgage Type
Unknown
Create a Home Valuation Report for This Property
The Home Valuation Report is an in-depth analysis detailing your home's value as well as a comparison with similar homes in the area
Home Values in the Area
Average Home Value in this Area
Purchase History
| Date | Buyer | Sale Price | Title Company |
|---|---|---|---|
| Merritt Laura | $250,000 | Townsend Title Insurance Agenc | |
| Shock Kevin Owen | $168,000 | Superior Ttl & Closings Llc | |
| Monaco William | $212,500 | Attorney |
Source: Public Records
Mortgage History
| Date | Status | Borrower | Loan Amount |
|---|---|---|---|
| Open | Merritt Laura | $225,000 | |
| Previous Owner | Monaco William | $169,900 |
Source: Public Records
Tax History Compared to Growth
Tax History
| Year | Tax Paid | Tax Assessment Tax Assessment Total Assessment is a certain percentage of the fair market value that is determined by local assessors to be the total taxable value of land and additions on the property. | Land | Improvement |
|---|---|---|---|---|
| 2025 | $2,575 | $158,189 | -- | $158,189 |
| 2024 | $2,575 | $178,419 | -- | $178,419 |
| 2023 | $2,708 | $184,969 | $0 | $0 |
| 2022 | $2,528 | $179,582 | $0 | $179,582 |
| 2021 | $2,344 | $119,797 | $0 | $119,797 |
| 2020 | $2,464 | $121,933 | $0 | $121,933 |
| 2019 | $2,377 | $117,895 | $0 | $117,895 |
| 2018 | $2,422 | $117,895 | $0 | $117,895 |
| 2017 | $2,364 | $118,703 | $0 | $118,703 |
| 2016 | $2,201 | $108,931 | $0 | $108,931 |
| 2015 | $2,036 | $96,200 | $0 | $96,200 |
| 2014 | $1,861 | $86,700 | $0 | $86,700 |
| 2013 | -- | $75,500 | $0 | $75,500 |
Source: Public Records
Map
Nearby Homes
- 1837 Concordia Lake Cir Unit 1204
- 1859 Concordia Lake Cir Unit 703
- 1865 Concordia Lake Cir Unit 408
- 1860 Concordia Lake Cir Unit 604
- 1831 Concordia Lake Cir Unit 1409
- 1866 Concordia Lake Cir Unit 507
- 1808 Kismet Pkwy E
- 1804 Kismet Pkwy E
- 1715 NE 27th St
- 4000 NE 10th Ave
- 914 NE 36th St
- 2611 NE 19th Place
- 1416 Durden Pkwy
- 1816 Kismet Pkwy E
- 2120 NE 25th Terrace
- 1817 NE 17th St
- 1714 NE 26th Terrace
- 303 NE 17th Place
- 1206 NE 20th Place
- 2213 NE 14th Ave
- 1843 Concordia Lake Cir Unit 1006
- 1843 Concordia Lake Cir Unit 1005
- 1843 Concordia Lake Cir Unit 1007
- 1843 Concordia Lake Cir Unit 1008
- 1843 Concordia Lake Cir Unit 1001
- 1843 Concordia Lake Cir Unit 1003
- 1843 Concordia Lake Cir Unit 1004
- 1843 Concordia Lake Cir Unit 1002
- 1843 Concordia Lake Cir Unit 1010
- 1843 Concordia Lake Cir Unit 1009
- 1843 Concordia Lake Cir Unit 1002
- 1843 Concordia Lake Cir Unit 1005
- 1843 Concordia Lake Cir Unit 1007
- 1843 Concordia Lake Cir Unit 1010
- 1843 Concordia Lake Cir Unit 1008
- 1842 Concordia Lake Cir Unit 1102
- 1842 Concordia Lake Cir Unit 1101
- 1842 Concordia Lake Cir Unit 1108
- 1842 Concordia Lake Cir Unit 1107
- 1842 Concordia Lake Cir Unit 1106