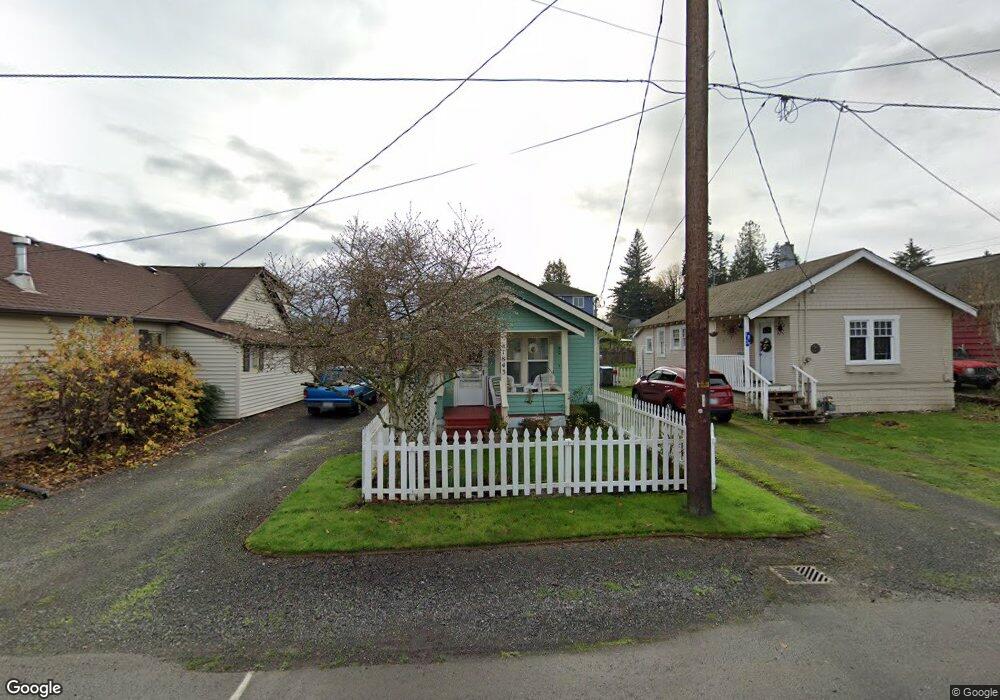
1843 NE Pacific Ave Keyport, WA 98345
Estimated Value: $316,941 - $483,000
2
Beds
1
Bath
680
Sq Ft
$553/Sq Ft
Est. Value
About This Home
This home is located at 1843 NE Pacific Ave, Keyport, WA 98345 and is currently estimated at $375,985, approximately $552 per square foot. 1843 NE Pacific Ave is a home with nearby schools including Hilder Pearson Elementary School, Poulsbo Middle School, and North Kitsap High School.
Ownership History
Date
Name
Owned For
Owner Type
Purchase Details
Closed on
Jun 18, 2003
Sold by
Cobb Joseph M and Cobb Melissa L
Bought by
Dubois Deborah
Current Estimated Value
Home Financials for this Owner
Home Financials are based on the most recent Mortgage that was taken out on this home.
Original Mortgage
$79,900
Outstanding Balance
$33,957
Interest Rate
5.37%
Mortgage Type
Purchase Money Mortgage
Estimated Equity
$342,028
Purchase Details
Closed on
Jul 21, 1998
Sold by
Stevens Don T and Stevens Karol R
Bought by
Cobb Joseph M and Cobb Melissa L
Home Financials for this Owner
Home Financials are based on the most recent Mortgage that was taken out on this home.
Original Mortgage
$72,420
Interest Rate
7.01%
Mortgage Type
VA
Purchase Details
Closed on
Aug 4, 1994
Sold by
Miller Lorin M and Miller Helen A
Bought by
Stevens Don T and Stevens Karol R
Home Financials for this Owner
Home Financials are based on the most recent Mortgage that was taken out on this home.
Original Mortgage
$38,000
Interest Rate
8.51%
Mortgage Type
Seller Take Back
Create a Home Valuation Report for This Property
The Home Valuation Report is an in-depth analysis detailing your home's value as well as a comparison with similar homes in the area
Home Values in the Area
Average Home Value in this Area
Purchase History
| Date | Buyer | Sale Price | Title Company |
|---|---|---|---|
| Dubois Deborah | $99,900 | Transnation Title Ins Co | |
| Cobb Joseph M | $71,000 | Pacific Northwest Title | |
| Stevens Don T | $43,000 | Stewart Title Company |
Source: Public Records
Mortgage History
| Date | Status | Borrower | Loan Amount |
|---|---|---|---|
| Open | Dubois Deborah | $79,900 | |
| Previous Owner | Cobb Joseph M | $72,420 | |
| Previous Owner | Stevens Don T | $38,000 |
Source: Public Records
Tax History Compared to Growth
Tax History
| Year | Tax Paid | Tax Assessment Tax Assessment Total Assessment is a certain percentage of the fair market value that is determined by local assessors to be the total taxable value of land and additions on the property. | Land | Improvement |
|---|---|---|---|---|
| 2026 | $287 | $255,700 | $87,300 | $168,400 |
| 2025 | $287 | $255,700 | $87,300 | $168,400 |
| 2024 | $277 | $202,590 | $87,300 | $115,290 |
| 2023 | $281 | $202,590 | $87,300 | $115,290 |
| 2022 | $297 | $164,580 | $72,750 | $91,830 |
| 2021 | $313 | $147,530 | $65,180 | $82,350 |
| 2020 | $318 | $141,130 | $62,270 | $78,860 |
| 2019 | $321 | $132,070 | $58,200 | $73,870 |
| 2018 | $1,210 | $96,110 | $48,500 | $47,610 |
| 2017 | $1,184 | $96,110 | $48,500 | $47,610 |
| 2016 | $1,212 | $91,080 | $48,500 | $42,580 |
| 2015 | $1,201 | $91,080 | $48,500 | $42,580 |
| 2014 | -- | $88,740 | $48,500 | $40,240 |
| 2013 | -- | $88,740 | $48,500 | $40,240 |
Source: Public Records
Map
Nearby Homes
- 1954 NE Grandview Blvd
- 1922 NE Fir St
- 15485 NE Peterson Rd
- 1314 NE South Petterson Rd
- 1422 NW Swenson Ct
- 1533 NE Tagholm Rd
- 15809 Virginia Point Rd NE
- 1354 Hoffs Dr
- 1678 NE Jacobson Rd
- 15739 Virginia Loop Rd NE
- 16778 Lemolo Shore Dr NE
- 2393 NE Trail Way
- 0 Lemolo Shore Parcel 4-019 Dr NE
- 0 Lemolo Shore Parcel 3-006 Dr NE
- 13977 Blackberry Ln NE
- 17008 Peterson Way NE
- 15905 Nesika Bay Rd NE
- 13423 Graywolf Place NE
- 0 NE Solar View Ct
- 17535 NE Midnight Sun Loop
- 1835 NE Pacific Ave
- 1851 NE Pacific Ave
- 1819 NE Pacific Ave
- 1852 NE Pacific Ave
- 1776 NE Poulsbo Ave
- 1800 NE Poulsbo Ave
- 1788 NE Poulsbo Ave
- 1849 NE Grandview Blvd
- 1820 NE Pacific Ave
- 1803 NE Pacific Ave
- 1762 NE Poulsbo Ave
- 1871 NE Pacific Ave
- 1876 NE Pacific Ave
- 1744 NE Poulsbo Ave
- 1844 NE Poulsbo Ave
- 1800 NE Pacific Ave
- 1889 NE Pacific Ave
- 1872 NE Pacific Ave
- 1872 NE Pacific Ave Unit A&B
- 1872 NE Pacific Ave Unit B