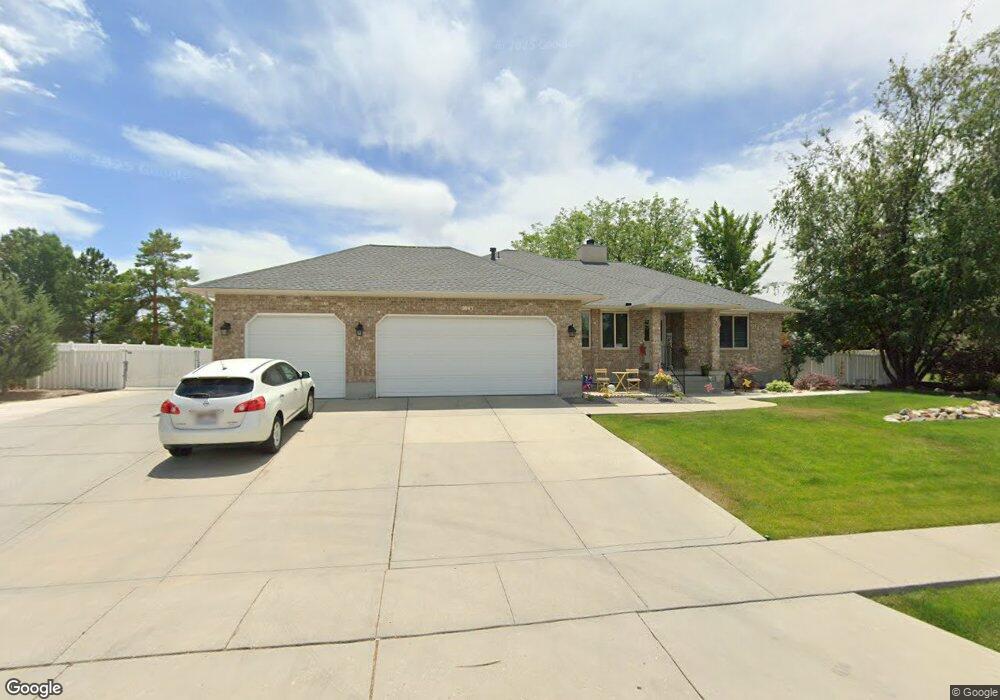
1843 W 10740 S South Jordan, UT 84095
Estimated Value: $768,000 - $816,000
6
Beds
3
Baths
3,660
Sq Ft
$218/Sq Ft
Est. Value
About This Home
This home is located at 1843 W 10740 S, South Jordan, UT 84095 and is currently estimated at $799,092, approximately $218 per square foot. 1843 W 10740 S is a home located in Salt Lake County with nearby schools including Monte Vista Elementary School, South Jordan Middle School, and Hawthorn Academy South Jordan.
Ownership History
Date
Name
Owned For
Owner Type
Purchase Details
Closed on
Sep 23, 2020
Sold by
Fisher Gary L and Fisher Malissa
Bought by
Fisher Malissa and Fisher Gary Lee
Current Estimated Value
Home Financials for this Owner
Home Financials are based on the most recent Mortgage that was taken out on this home.
Original Mortgage
$417,000
Outstanding Balance
$370,060
Interest Rate
2.9%
Mortgage Type
New Conventional
Estimated Equity
$429,032
Purchase Details
Closed on
Nov 15, 2016
Sold by
Suntek Llc
Bought by
Fisher Gary L and Fisher Malissa
Home Financials for this Owner
Home Financials are based on the most recent Mortgage that was taken out on this home.
Original Mortgage
$324,900
Interest Rate
3.42%
Mortgage Type
New Conventional
Purchase Details
Closed on
Nov 20, 2015
Sold by
Mottola Jim and Mottola Becky
Bought by
Suntek Llc
Purchase Details
Closed on
Jul 1, 1994
Sold by
Sk Builders Inc
Bought by
Mottola Jim and Mottola Becky
Purchase Details
Closed on
Oct 29, 1993
Sold by
Mountain View Realty Inc
Bought by
Sk Builders Inc
Create a Home Valuation Report for This Property
The Home Valuation Report is an in-depth analysis detailing your home's value as well as a comparison with similar homes in the area
Home Values in the Area
Average Home Value in this Area
Purchase History
| Date | Buyer | Sale Price | Title Company |
|---|---|---|---|
| Fisher Malissa | -- | Accommodation | |
| Fisher Gary L | -- | Meridian Title | |
| Suntek Llc | -- | None Available | |
| Mottola Jim | -- | -- | |
| Sk Builders Inc | -- | -- |
Source: Public Records
Mortgage History
| Date | Status | Borrower | Loan Amount |
|---|---|---|---|
| Open | Fisher Malissa | $417,000 | |
| Closed | Fisher Gary L | $324,900 |
Source: Public Records
Tax History Compared to Growth
Tax History
| Year | Tax Paid | Tax Assessment Tax Assessment Total Assessment is a certain percentage of the fair market value that is determined by local assessors to be the total taxable value of land and additions on the property. | Land | Improvement |
|---|---|---|---|---|
| 2025 | $3,734 | $725,800 | $285,000 | $440,800 |
| 2024 | $3,734 | $708,900 | $276,900 | $432,000 |
| 2023 | $3,734 | $680,100 | $271,400 | $408,700 |
| 2022 | $3,962 | $695,700 | $266,100 | $429,600 |
| 2021 | $3,309 | $533,100 | $225,600 | $307,500 |
| 2020 | $3,147 | $475,200 | $224,500 | $250,700 |
| 2019 | $3,114 | $462,300 | $221,000 | $241,300 |
| 2018 | $2,928 | $432,500 | $146,300 | $286,200 |
| 2017 | $2,804 | $405,900 | $146,300 | $259,600 |
| 2016 | $2,660 | $364,800 | $146,300 | $218,500 |
| 2015 | $2,617 | $349,000 | $167,500 | $181,500 |
| 2014 | $2,465 | $323,100 | $156,800 | $166,300 |
Source: Public Records
Map
Nearby Homes
- 481 W Haven Hill Way S Unit 9
- 1097 W Kings Landing Ct Unit 1
- 11302 S Haven Willow Way W
- 11316 S Haven Willow Way W Unit 5
- 1096 W Kings Landing Ct Unit 2
- 9584 S Ember Glow Ct W Unit D
- 1085 W Kings Landing Ct S Unit 6
- 9566 S Ember Glow Ct Unit D
- 9553 S Ember Glow Ct Unit D
- 524 W Haven Hill Way S Unit 3
- 9584 S Ember Glow Ct Unit C
- 9822 S South Temple Dr W
- 11328 S Haven Willow Way W Unit 6
- 1071 W Kings Landing Ct Unit 5
- 10596 S Pinyon Pines Ct
- 10831 S Wynview Ln
- 10749 S 2200 W
- 10804 S Haven Landing Dr
- 10838 S Haven Landing Dr
- 1469 Old Cyprus Ct
- 1823 W 10740 S
- 1867 W 10740 S
- 1848 W 10740 S
- 1826 W 10740 S
- 1801 W 10740 S
- 1889 W 10740 S
- 1882 W 10740 S
- 1802 W 10740 S
- 10711 S 1865 W
- 10672 S Winter Haven Ct
- 10672 S Winter Haven Ct Unit 3
- 1781 W 10740 S
- 10712 S 1865 W
- 1904 W 10740 S
- 1913 W 10740 S
- 10701 S 1865 W
- 10658 S Winter Haven Ct Unit 2
- 1774 W 10740 S
- 10671 S Winter Haven Ct Unit 4
- 1903 W 10695 S