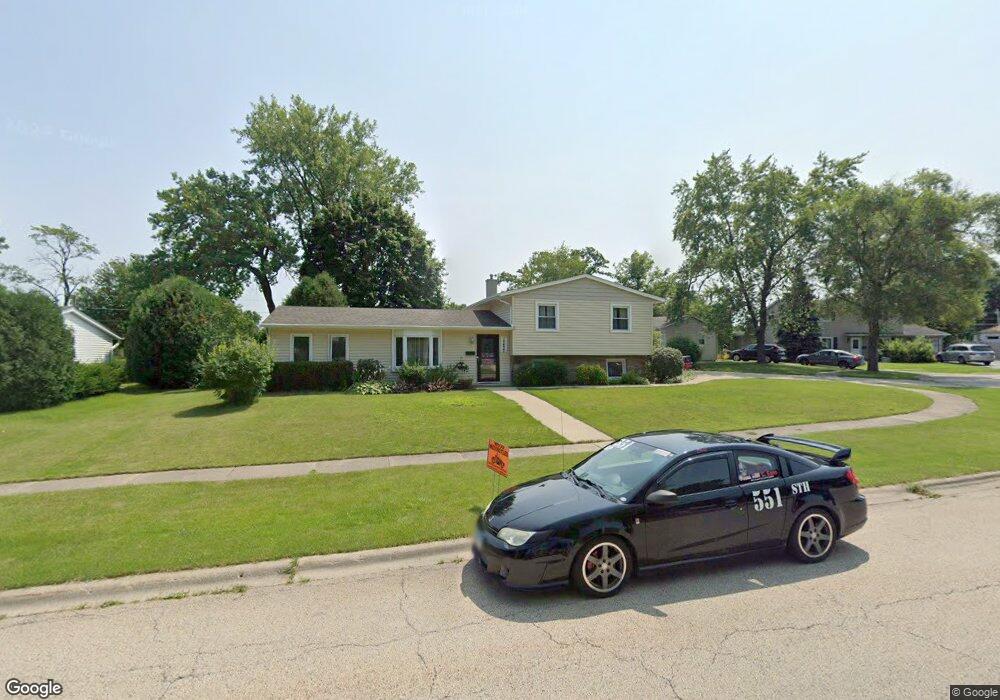
18433 W Streamwood Ct Gurnee, IL 60031
Estimated Value: $296,000 - $388,000
--
Bed
2
Baths
1,309
Sq Ft
$249/Sq Ft
Est. Value
About This Home
This home is located at 18433 W Streamwood Ct, Gurnee, IL 60031 and is currently estimated at $325,321, approximately $248 per square foot. 18433 W Streamwood Ct is a home located in Lake County with nearby schools including Woodland Primary School, Woodland Intermediate School, and Woodland Elementary School.
Ownership History
Date
Name
Owned For
Owner Type
Purchase Details
Closed on
Nov 17, 2003
Sold by
Drwila Mark J
Bought by
Gano Christopher and Gano Darleen
Current Estimated Value
Home Financials for this Owner
Home Financials are based on the most recent Mortgage that was taken out on this home.
Original Mortgage
$206,000
Outstanding Balance
$95,701
Interest Rate
6.03%
Mortgage Type
VA
Estimated Equity
$229,620
Purchase Details
Closed on
Jun 20, 2002
Sold by
Lebrun Jay A and Lebrun Amanda C
Bought by
Drwila Mark J
Home Financials for this Owner
Home Financials are based on the most recent Mortgage that was taken out on this home.
Original Mortgage
$130,000
Interest Rate
6.7%
Purchase Details
Closed on
Jun 26, 1997
Sold by
Butler James W and Carroll Butler Ann F
Bought by
Lebrun Jay A and Lebrun Amanda C
Home Financials for this Owner
Home Financials are based on the most recent Mortgage that was taken out on this home.
Original Mortgage
$133,450
Interest Rate
7.94%
Mortgage Type
FHA
Create a Home Valuation Report for This Property
The Home Valuation Report is an in-depth analysis detailing your home's value as well as a comparison with similar homes in the area
Home Values in the Area
Average Home Value in this Area
Purchase History
| Date | Buyer | Sale Price | Title Company |
|---|---|---|---|
| Gano Christopher | $208,000 | -- | |
| Drwila Mark J | $162,500 | -- | |
| Lebrun Jay A | $92,000 | -- |
Source: Public Records
Mortgage History
| Date | Status | Borrower | Loan Amount |
|---|---|---|---|
| Open | Gano Christopher | $206,000 | |
| Previous Owner | Drwila Mark J | $130,000 | |
| Previous Owner | Lebrun Jay A | $133,450 |
Source: Public Records
Tax History Compared to Growth
Tax History
| Year | Tax Paid | Tax Assessment Tax Assessment Total Assessment is a certain percentage of the fair market value that is determined by local assessors to be the total taxable value of land and additions on the property. | Land | Improvement |
|---|---|---|---|---|
| 2024 | $8,226 | $98,074 | $13,913 | $84,161 |
| 2023 | $8,226 | $88,402 | $12,541 | $75,861 |
| 2022 | $8,146 | $81,666 | $13,048 | $68,618 |
| 2021 | $7,112 | $75,374 | $12,042 | $63,332 |
| 2020 | $6,850 | $73,521 | $11,746 | $61,775 |
| 2019 | $6,716 | $71,387 | $11,405 | $59,982 |
| 2018 | $5,779 | $63,556 | $15,621 | $47,935 |
| 2017 | $5,781 | $61,734 | $15,173 | $46,561 |
| 2016 | $5,741 | $58,985 | $14,497 | $44,488 |
| 2015 | $5,551 | $55,942 | $13,749 | $42,193 |
| 2014 | $5,122 | $53,614 | $14,317 | $39,297 |
| 2012 | $5,555 | $54,025 | $14,427 | $39,598 |
Source: Public Records
Map
Nearby Homes
- 18325 W Lakeview Terrace
- 36712 N Traer Terrace
- 18229 W Banbury Dr
- 18758 W Highfield Dr
- 18595 W Judy Dr
- 18705 W Ash Dr
- 17917 W Pond Ridge Cir
- 36688 N Yew Tree Dr
- 36873 N Deer Trail Dr
- 17876 W Braewick Rd
- 1603 Napa Dr
- 36225 N Us Highway 45
- 17781 W Elsbury St
- 17820 W Braewick Rd
- 1593 Vineyard Dr
- 17775 W Braewick Rd
- 1496 Smythe Ct
- 36259 N Field View Dr
- 17925 W Stearns School Rd
- 7623 Beringer Ct
- 18403 W Streamwood Ct
- 18441 W Streamwood Ct
- 36402 N Streamwood Dr
- 18449 W Streamwood Ct
- 18430 W Streamwood Ct
- 18451 W Streamwood Ct
- 36436 N Streamwood Dr
- 36396 N Streamwood Dr
- 18455 W Streamwood Ct
- 18446 W Streamwood Ct
- 36427 N Streamwood Dr
- 18452 W Streamwood Ct
- 36449 N Traer Terrace Unit 4
- 36437 N Streamwood Dr
- 36437 N Traer Terrace
- 36460 N Streamwood Dr
- 36461 N Traer Terrace
- 36473 N Traer Terrace Unit 4
- 18453 W Geier Rd
- 36397 N Streamwood Dr