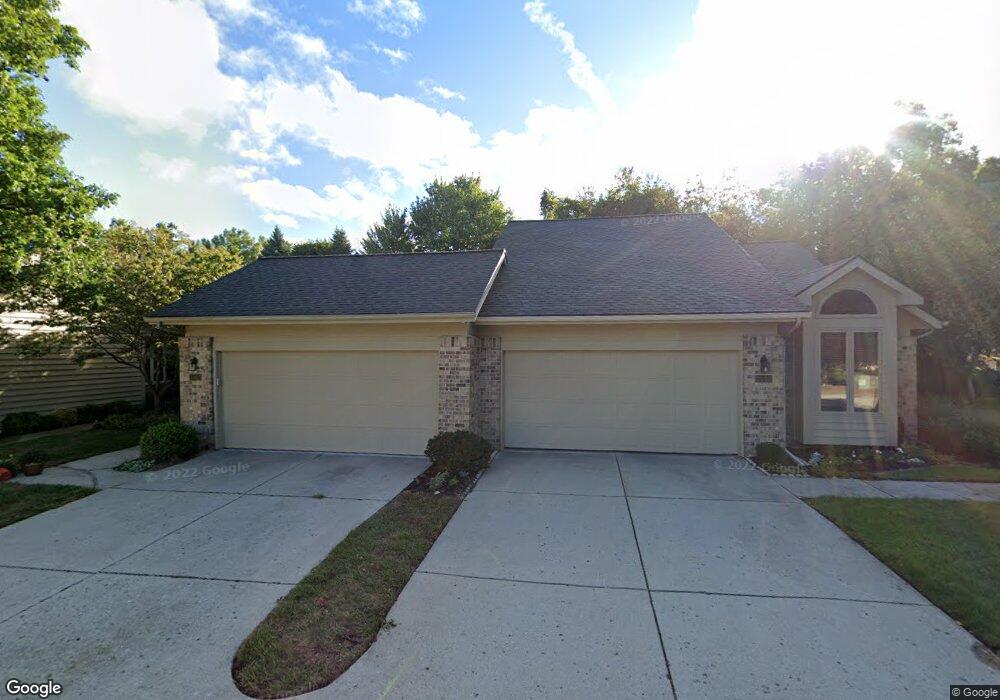
1844 Cross Bend St NE Unit 61 Grand Rapids, MI 49505
Creston NeighborhoodEstimated Value: $335,263 - $369,000
3
Beds
3
Baths
1,835
Sq Ft
$194/Sq Ft
Est. Value
About This Home
This home is located at 1844 Cross Bend St NE Unit 61, Grand Rapids, MI 49505 and is currently estimated at $356,566, approximately $194 per square foot. 1844 Cross Bend St NE Unit 61 is a home located in Kent County with nearby schools including Riverside Middle School, Union High School, and Knapp Charter Academy.
Ownership History
Date
Name
Owned For
Owner Type
Purchase Details
Closed on
Apr 2, 2021
Sold by
Fischer Daniel W and Fischer Julianne J
Bought by
Daniel And Julianne Fischer Living Trust
Current Estimated Value
Purchase Details
Closed on
Aug 8, 2014
Sold by
Zalewski Charles and Zalewski Rebecca A
Bought by
Zalewski Family Trust
Purchase Details
Closed on
Dec 19, 2003
Sold by
Buchanan P Joyce
Bought by
Zalewski Charles and Zalewski Rebecca A
Home Financials for this Owner
Home Financials are based on the most recent Mortgage that was taken out on this home.
Original Mortgage
$115,000
Interest Rate
5%
Mortgage Type
Purchase Money Mortgage
Purchase Details
Closed on
Aug 1, 1995
Bought by
Zalewski Buchanan P and Zalewski Charles Rebecca
Purchase Details
Closed on
Jul 30, 1995
Sold by
Bchnn Bchnn P P and Bchnn Bchanan P
Bought by
Zalewski Charles Rebecca
Create a Home Valuation Report for This Property
The Home Valuation Report is an in-depth analysis detailing your home's value as well as a comparison with similar homes in the area
Home Values in the Area
Average Home Value in this Area
Purchase History
| Date | Buyer | Sale Price | Title Company |
|---|---|---|---|
| Daniel And Julianne Fischer Living Trust | -- | None Listed On Document | |
| Zalewski Family Trust | -- | None Available | |
| Zalewski Charles | -- | -- | |
| Zalewski Charles | $165,000 | -- | |
| Zalewski Buchanan P | $122,700 | -- | |
| Zalewski Charles Rebecca | -- | -- |
Source: Public Records
Mortgage History
| Date | Status | Borrower | Loan Amount |
|---|---|---|---|
| Previous Owner | Zalewski Charles | $115,000 |
Source: Public Records
Tax History Compared to Growth
Tax History
| Year | Tax Paid | Tax Assessment Tax Assessment Total Assessment is a certain percentage of the fair market value that is determined by local assessors to be the total taxable value of land and additions on the property. | Land | Improvement |
|---|---|---|---|---|
| 2025 | $2,690 | $153,500 | $0 | $0 |
| 2024 | $2,690 | $147,300 | $0 | $0 |
| 2023 | $2,729 | $127,200 | $0 | $0 |
| 2022 | $2,591 | $122,900 | $0 | $0 |
| 2021 | $2,533 | $121,800 | $0 | $0 |
| 2020 | $2,422 | $115,500 | $0 | $0 |
| 2019 | $2,536 | $109,700 | $0 | $0 |
| 2018 | $2,449 | $100,300 | $0 | $0 |
| 2017 | $2,385 | $83,600 | $0 | $0 |
| 2016 | $2,413 | $80,100 | $0 | $0 |
| 2015 | $2,244 | $80,100 | $0 | $0 |
| 2013 | -- | $66,000 | $0 | $0 |
Source: Public Records
Map
Nearby Homes
- 1759 Briarcliff Dr NE
- 2268 Thistledowne Dr NE
- 2037 Tall Meadow St NE Unit 13
- 2016 Tall Meadow St NE
- 2058 Ken Ade St NE Unit 147
- 2041 Krislin St
- 2112 Jo Dean Ct NE
- 2753 Dean Lake Ave NE
- 2027 Joan Ave NE
- 1335 Knapp St NE
- 2324 Whimbrel Ct NE
- 1739 Waldorn Ave NE
- 2420 Hylane Ct NE
- 2100 Dawson Ave NE
- 1600 Cherry Hill Dr NE
- 1524 Sweet St NE
- 2833 Aldale Dr NE
- 1335 Northlawn St NE
- 1666 Carlton Ave NE
- 1444 Sweet St NE
- 1846 Cross Bend St NE
- 1838 Cross Bend St NE
- 1848 Cross Bend St NE
- 1836 Cross Bend St NE
- 1836 Cross Bend St NE Unit 71
- 1850 Cross Bend St NE
- 1834 Cross Bend St NE
- 1837 Cross Bend St NE
- 1841 Cross Bend St NE
- 1841 Cross Bend St NE Unit 60
- 1835 Cross Bend St NE
- 1835 Cross Bend St NE Unit 66
- 1843 Cross Bend St NE Unit 59
- 1833 Cross Bend St NE
- 1833 Cross Bend St NE Unit 67
- 1845 Cross Bend St NE
- 1845 Cross Bend St NE Unit 58
- 1832 Cross Bend St NE Unit 69
- 1900 Cross Bend St NE Unit 53
- 1831 Cross Bend St NE Unit 68