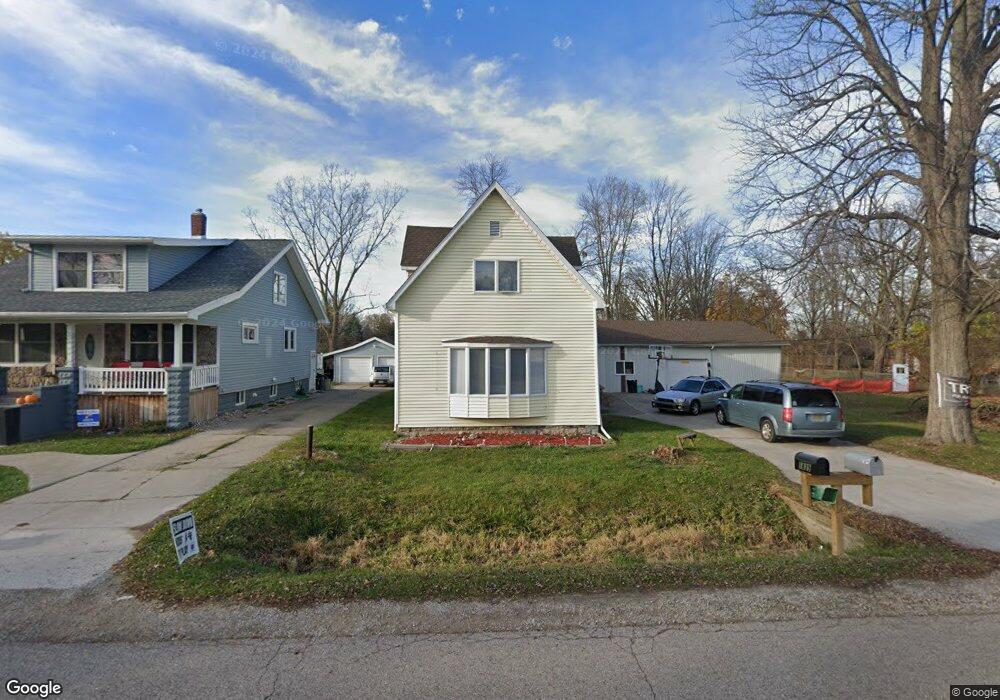
1844 Henry St Port Huron, MI 48060
Estimated Value: $167,000 - $208,000
3
Beds
2
Baths
1,178
Sq Ft
$160/Sq Ft
Est. Value
About This Home
This home is located at 1844 Henry St, Port Huron, MI 48060 and is currently estimated at $188,810, approximately $160 per square foot. 1844 Henry St is a home located in St. Clair County with nearby schools including H.D. Crull Elementary School, Holland Woods Middle School, and Port Huron High School.
Ownership History
Date
Name
Owned For
Owner Type
Purchase Details
Closed on
Feb 25, 2021
Sold by
Hustek David J and Hustek Janet L
Bought by
Fgph Holdings Llc
Current Estimated Value
Purchase Details
Closed on
Jul 8, 2010
Sold by
Hicks Darryl and Hicks Lea
Bought by
Hustek David J and Hustek Janet L
Create a Home Valuation Report for This Property
The Home Valuation Report is an in-depth analysis detailing your home's value as well as a comparison with similar homes in the area
Home Values in the Area
Average Home Value in this Area
Purchase History
| Date | Buyer | Sale Price | Title Company |
|---|---|---|---|
| Fgph Holdings Llc | $59,000 | Transnation Title Agency | |
| Hustek David J | -- | None Available |
Source: Public Records
Tax History Compared to Growth
Tax History
| Year | Tax Paid | Tax Assessment Tax Assessment Total Assessment is a certain percentage of the fair market value that is determined by local assessors to be the total taxable value of land and additions on the property. | Land | Improvement |
|---|---|---|---|---|
| 2025 | $4,062 | $83,700 | $0 | $0 |
| 2024 | $2,793 | $89,800 | $0 | $0 |
| 2023 | $2,618 | $83,200 | $0 | $0 |
| 2022 | $4,799 | $69,000 | $0 | $0 |
| 2021 | $2,523 | $64,200 | $0 | $0 |
| 2020 | $2,523 | $60,200 | $60,200 | $0 |
| 2019 | $2,476 | $45,900 | $0 | $0 |
| 2018 | $2,418 | $45,900 | $0 | $0 |
| 2017 | $2,365 | $54,300 | $0 | $0 |
| 2016 | $1,895 | $54,300 | $0 | $0 |
| 2015 | -- | $55,000 | $55,000 | $0 |
| 2014 | -- | $52,900 | $52,900 | $0 |
| 2013 | -- | $51,400 | $0 | $0 |
Source: Public Records
Map
Nearby Homes