1844 N 31st St Lincoln, NE 68503
Clinton NeighborhoodEstimated Value: $162,000 - $192,000
3
Beds
2
Baths
884
Sq Ft
$196/Sq Ft
Est. Value
About This Home
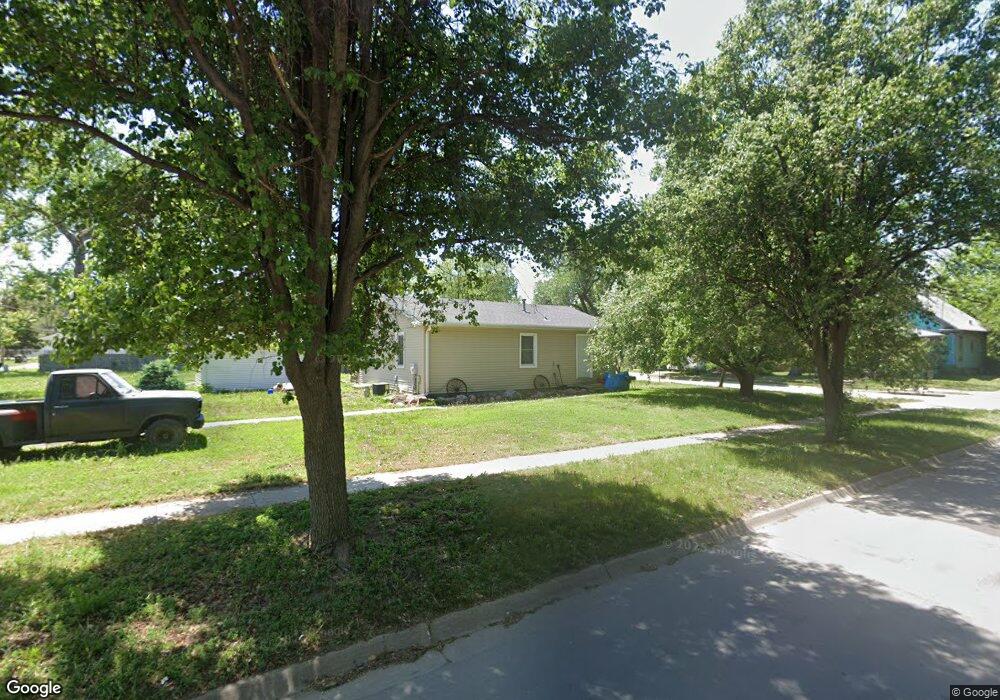
This home is located at 1844 N 31st St, Lincoln, NE 68503 and is currently estimated at $173,224, approximately $195 per square foot. 1844 N 31st St is a home located in Lancaster County with nearby schools including Clinton Elementary School, C. Culler Middle School, and Lincoln Northeast High School.
Ownership History
Date
Name
Owned For
Owner Type
Purchase Details
Closed on
Mar 30, 2006
Sold by
Yates John A and Yates Kelly
Bought by
Yates Kelly
Current Estimated Value
Purchase Details
Closed on
Aug 11, 1999
Sold by
Lincoln/Lancaster Cnty Habitat For Human
Bought by
Yates John A and Yates Kelly
Purchase Details
Closed on
May 11, 1998
Sold by
Culver Gary R
Bought by
Lincoln/Lancaster County Habitat For Hum
Create a Home Valuation Report for This Property
The Home Valuation Report is an in-depth analysis detailing your home's value as well as a comparison with similar homes in the area
Home Values in the Area
Average Home Value in this Area
Purchase History
| Date | Buyer | Sale Price | Title Company |
|---|---|---|---|
| Yates Kelly | -- | None Available | |
| Yates John A | $50,000 | -- | |
| Lincoln/Lancaster County Habitat For Hum | $18,000 | -- |
Source: Public Records
Tax History Compared to Growth
Tax History
| Year | Tax Paid | Tax Assessment Tax Assessment Total Assessment is a certain percentage of the fair market value that is determined by local assessors to be the total taxable value of land and additions on the property. | Land | Improvement |
|---|---|---|---|---|
| 2025 | $1,978 | $170,800 | $37,000 | $133,800 |
| 2024 | $1,978 | $141,500 | $30,000 | $111,500 |
| 2023 | $2,231 | $133,100 | $30,000 | $103,100 |
| 2022 | $2,354 | $118,100 | $25,000 | $93,100 |
| 2021 | $2,227 | $118,100 | $25,000 | $93,100 |
| 2020 | $1,920 | $100,500 | $25,000 | $75,500 |
| 2019 | $1,921 | $100,500 | $25,000 | $75,500 |
| 2018 | $2,040 | $106,300 | $25,000 | $81,300 |
| 2017 | $2,059 | $106,300 | $25,000 | $81,300 |
| 2016 | $1,850 | $95,000 | $25,000 | $70,000 |
| 2015 | $1,837 | $95,000 | $25,000 | $70,000 |
| 2014 | $1,591 | $81,800 | $25,000 | $56,800 |
| 2013 | -- | $81,800 | $25,000 | $56,800 |
Source: Public Records
Map
Nearby Homes