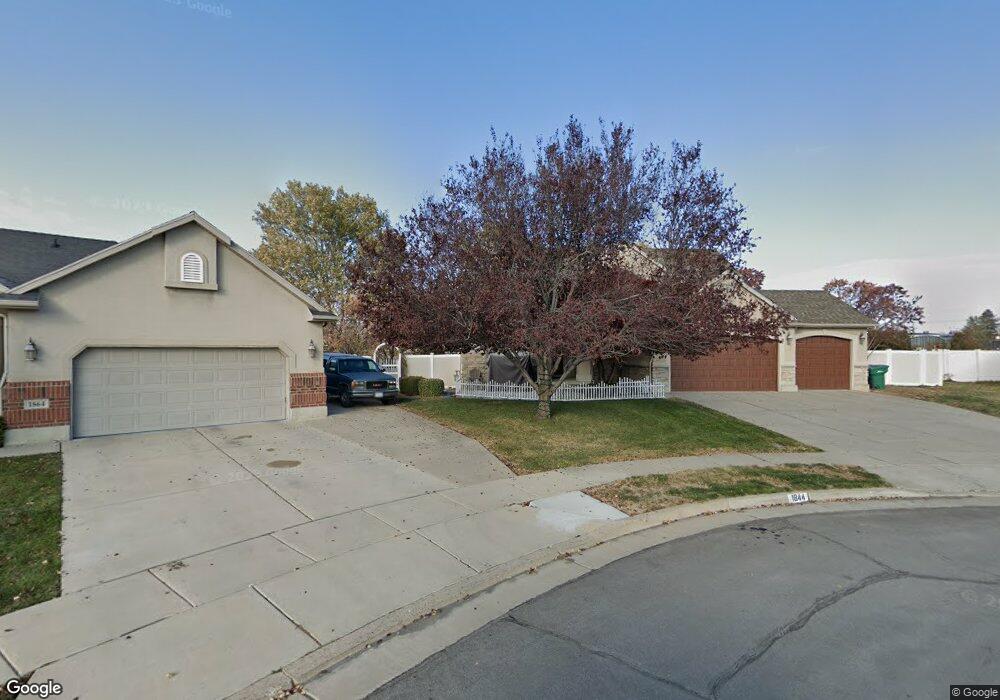
1844 S 350 E Clearfield, UT 84015
Estimated Value: $574,000 - $682,000
4
Beds
4
Baths
3,375
Sq Ft
$185/Sq Ft
Est. Value
About This Home
This home is located at 1844 S 350 E, Clearfield, UT 84015 and is currently estimated at $625,233, approximately $185 per square foot. 1844 S 350 E is a home located in Davis County with nearby schools including Antelope Elementary School, North Davis Junior High School, and Clearfield High School.
Ownership History
Date
Name
Owned For
Owner Type
Purchase Details
Closed on
Dec 29, 2017
Sold by
Jones Lori S
Bought by
Farmer Matthew and Farmer Laura J
Current Estimated Value
Home Financials for this Owner
Home Financials are based on the most recent Mortgage that was taken out on this home.
Original Mortgage
$132,275
Outstanding Balance
$73,542
Interest Rate
3.9%
Mortgage Type
FHA
Estimated Equity
$551,691
Purchase Details
Closed on
Jan 20, 2017
Sold by
Jones Lori S
Bought by
Jones Lori S and Jones Revocable Trust
Purchase Details
Closed on
Nov 8, 2001
Sold by
Gmw Development Inc
Bought by
Jones Ben F and Jones Lori S
Home Financials for this Owner
Home Financials are based on the most recent Mortgage that was taken out on this home.
Original Mortgage
$171,000
Interest Rate
6.73%
Create a Home Valuation Report for This Property
The Home Valuation Report is an in-depth analysis detailing your home's value as well as a comparison with similar homes in the area
Home Values in the Area
Average Home Value in this Area
Purchase History
| Date | Buyer | Sale Price | Title Company |
|---|---|---|---|
| Farmer Matthew | -- | Pinnacle Title | |
| Jones Lori S | -- | -- | |
| Jones Lori S | -- | -- | |
| Jones Ben F | -- | Bonneville Title Company Inc |
Source: Public Records
Mortgage History
| Date | Status | Borrower | Loan Amount |
|---|---|---|---|
| Open | Farmer Matthew | $132,275 | |
| Previous Owner | Jones Ben F | $171,000 |
Source: Public Records
Tax History
| Year | Tax Paid | Tax Assessment Tax Assessment Total Assessment is a certain percentage of the fair market value that is determined by local assessors to be the total taxable value of land and additions on the property. | Land | Improvement |
|---|---|---|---|---|
| 2025 | $3,732 | $334,400 | $91,818 | $242,582 |
| 2024 | $3,570 | $322,300 | $87,624 | $234,676 |
| 2023 | $3,326 | $551,000 | $138,059 | $412,941 |
| 2022 | $3,511 | $314,600 | $77,018 | $237,582 |
| 2021 | $3,198 | $433,000 | $93,249 | $339,751 |
| 2020 | $2,938 | $395,000 | $80,698 | $314,302 |
| 2019 | $2,765 | $367,000 | $76,466 | $290,534 |
| 2018 | $2,637 | $341,000 | $67,871 | $273,129 |
| 2016 | $2,317 | $156,640 | $27,870 | $128,770 |
| 2015 | $2,293 | $147,785 | $27,870 | $119,915 |
| 2014 | $2,309 | $150,805 | $27,870 | $122,935 |
| 2013 | -- | $123,564 | $39,303 | $84,261 |
Source: Public Records
Map
Nearby Homes
- 460 E 1700 S Unit 1 & 2
- 1969 S 575 E
- 1877 S 725 E
- 906 E Sam Cir
- 195 E 2325 S
- 1250 N 2925 W
- 2345 S Main St
- 1685 S 245 W
- 1870 N Celia Way
- 1916 N Celia Way
- 1186 N 2425 W
- 369 W 1900 S
- 2480 S Main St
- 1876 W 1575 N Unit 237
- 1740 N Gregory Dr
- 1570 N 1875 W Unit 242
- 1570 N 1875 W
- 1558 N 1875 W
- 1558 N 1875 W Unit 245
- 3250 W 1075 N
Your Personal Tour Guide
Ask me questions while you tour the home.