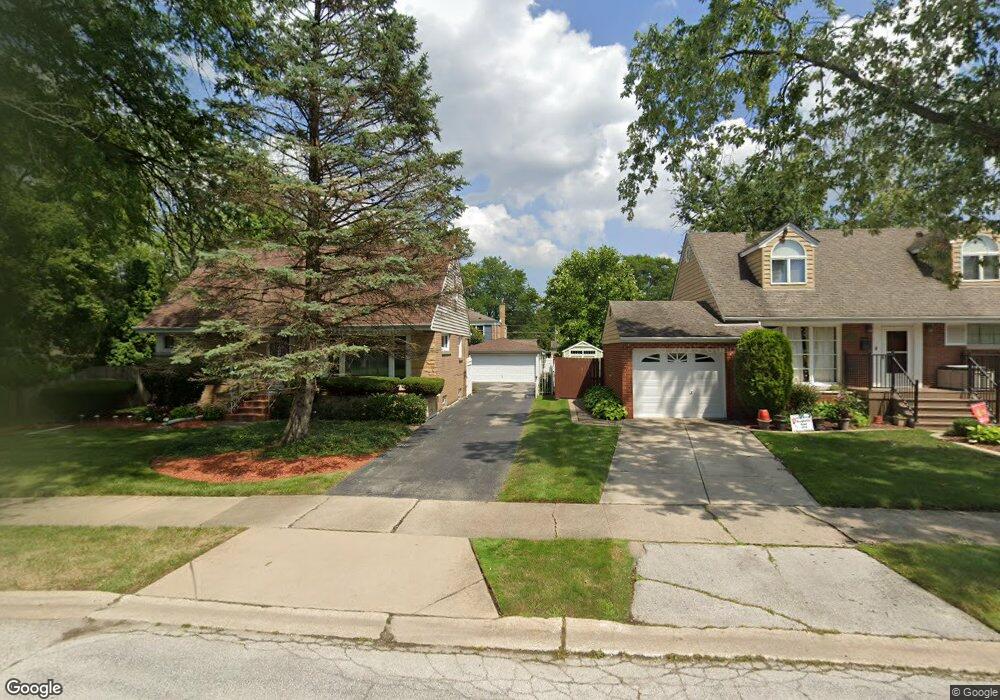
18449 Stedhall Rd Homewood, IL 60430
Estimated Value: $251,000 - $282,000
4
Beds
2
Baths
1,518
Sq Ft
$177/Sq Ft
Est. Value
About This Home
This home is located at 18449 Stedhall Rd, Homewood, IL 60430 and is currently estimated at $268,214, approximately $176 per square foot. 18449 Stedhall Rd is a home located in Cook County with nearby schools including Western Avenue Elementary School, Parker Junior High School, and Homewood-Flossmoor High School.
Ownership History
Date
Name
Owned For
Owner Type
Purchase Details
Closed on
Sep 15, 2022
Sold by
Washington Valerie F
Bought by
Valerie Felicia Washington Trust
Current Estimated Value
Purchase Details
Closed on
Jun 27, 2002
Sold by
Vandrie Glenn B and Vandrie Jean M
Bought by
Washington Valerie F
Home Financials for this Owner
Home Financials are based on the most recent Mortgage that was taken out on this home.
Original Mortgage
$126,000
Interest Rate
6.62%
Purchase Details
Closed on
Jul 26, 1996
Sold by
Labutis Joseph A and Labutis Joseph
Bought by
Vandrie Glenn B and Vandrie Jean M
Home Financials for this Owner
Home Financials are based on the most recent Mortgage that was taken out on this home.
Original Mortgage
$76,500
Interest Rate
8.33%
Purchase Details
Closed on
May 12, 1995
Sold by
Crocombe Robert T and Crocombe William E
Bought by
Labutis Joseph and Labutis Phyllis C
Create a Home Valuation Report for This Property
The Home Valuation Report is an in-depth analysis detailing your home's value as well as a comparison with similar homes in the area
Home Values in the Area
Average Home Value in this Area
Purchase History
| Date | Buyer | Sale Price | Title Company |
|---|---|---|---|
| Valerie Felicia Washington Trust | -- | None Listed On Document | |
| Washington Valerie F | $159,000 | -- | |
| Vandrie Glenn B | $90,000 | -- | |
| Labutis Joseph | -- | -- |
Source: Public Records
Mortgage History
| Date | Status | Borrower | Loan Amount |
|---|---|---|---|
| Previous Owner | Washington Valerie F | $126,000 | |
| Previous Owner | Vandrie Glenn B | $76,500 |
Source: Public Records
Tax History Compared to Growth
Tax History
| Year | Tax Paid | Tax Assessment Tax Assessment Total Assessment is a certain percentage of the fair market value that is determined by local assessors to be the total taxable value of land and additions on the property. | Land | Improvement |
|---|---|---|---|---|
| 2024 | $6,526 | $23,000 | $4,485 | $18,515 |
| 2023 | $4,358 | $23,000 | $4,485 | $18,515 |
| 2022 | $4,358 | $15,037 | $3,900 | $11,137 |
| 2021 | $4,438 | $15,037 | $3,900 | $11,137 |
| 2020 | $6,380 | $15,037 | $3,900 | $11,137 |
| 2019 | $6,554 | $16,720 | $3,510 | $13,210 |
| 2018 | $6,380 | $16,720 | $3,510 | $13,210 |
| 2017 | $6,293 | $16,720 | $3,510 | $13,210 |
| 2016 | $4,943 | $12,630 | $3,120 | $9,510 |
| 2015 | $4,895 | $12,630 | $3,120 | $9,510 |
| 2014 | $4,823 | $12,630 | $3,120 | $9,510 |
| 2013 | $6,050 | $13,781 | $3,120 | $10,661 |
Source: Public Records
Map
Nearby Homes
- 18509 Stedhall Rd
- 18450 Stedhall Rd
- 18530 Stedhall Rd
- 2619 Alexander St
- 18418 Clyde Rd
- 18400 Cherry Creek Dr Unit 105
- 18340 Cherry Creek Dr Unit 7
- 2807 Willow Rd Unit 103
- 18330 Perth Ave
- 625 Perth Ave
- 710 Bruce Ave
- 18314 Dundee Ave
- 18210 Perth Ave
- 802 Argyle Ave
- 18157 Rockwell Ave
- 3013 Carmel Dr
- 846 Park Dr
- 3007 Monterey Dr
- 18310 Robin Ln Unit D2
- 18302 Robin Ln Unit D1
- 18455 Stedhall Rd
- 18433 Clyde Rd
- 18429 Clyde Rd
- 18459 Stedhall Rd
- 18448 Argyle Ave
- 18456 Argyle Ave
- 18442 Argyle Ave
- 18425 Clyde Rd
- 18460 Argyle Ave
- 18503 Stedhall Rd
- 18434 Argyle Ave
- 18419 Clyde Rd
- 18502 Argyle Ave
- 18502 Stedhall Rd
- 18453 Clyde Rd
- 18428 Argyle Ave
- 18415 Clyde Rd
- 18506 Argyle Ave
- 18430 Clyde Rd
- 18434 Clyde Rd