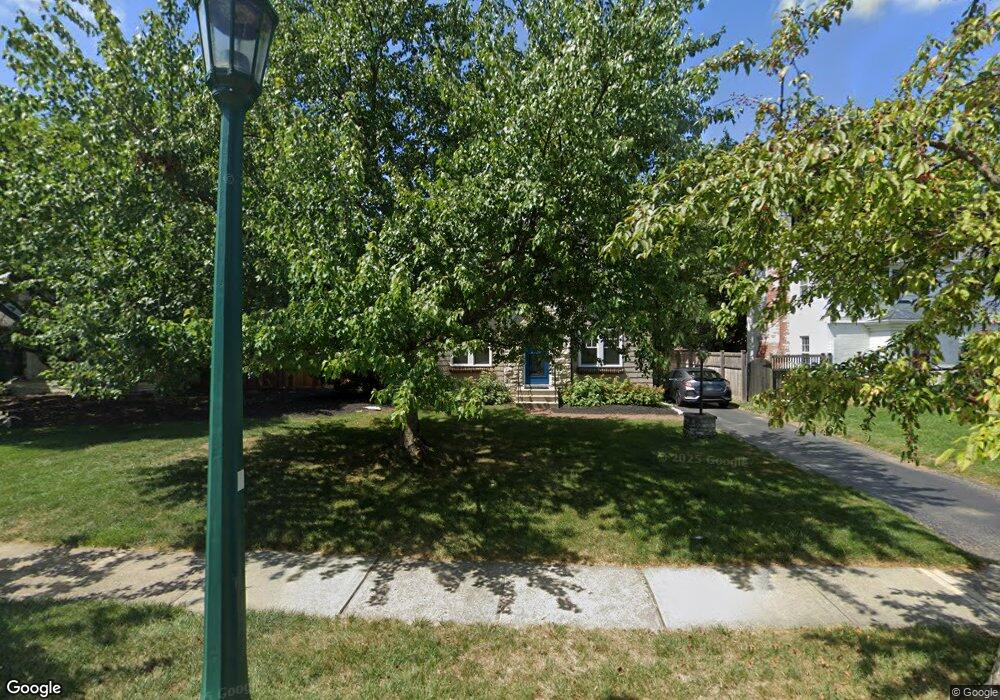
1845 Andover Rd Columbus, OH 43212
Estimated Value: $602,000 - $674,000
3
Beds
1
Bath
1,428
Sq Ft
$449/Sq Ft
Est. Value
About This Home
This home is located at 1845 Andover Rd, Columbus, OH 43212 and is currently estimated at $640,761, approximately $448 per square foot. 1845 Andover Rd is a home located in Franklin County with nearby schools including Barrington Road Elementary School, Jones Middle School, and Upper Arlington High School.
Ownership History
Date
Name
Owned For
Owner Type
Purchase Details
Closed on
May 31, 2001
Sold by
Harkey Gary C and Harkey Karen E
Bought by
Brockmeyer Brigg J and Brockmeyer Denean R
Current Estimated Value
Home Financials for this Owner
Home Financials are based on the most recent Mortgage that was taken out on this home.
Original Mortgage
$206,100
Outstanding Balance
$75,003
Interest Rate
7.18%
Estimated Equity
$565,758
Purchase Details
Closed on
Aug 29, 1994
Sold by
Wager David K
Bought by
Harkey Gary C and Harkey Karen E
Home Financials for this Owner
Home Financials are based on the most recent Mortgage that was taken out on this home.
Original Mortgage
$160,550
Interest Rate
8.72%
Mortgage Type
New Conventional
Purchase Details
Closed on
Jan 27, 1988
Create a Home Valuation Report for This Property
The Home Valuation Report is an in-depth analysis detailing your home's value as well as a comparison with similar homes in the area
Home Values in the Area
Average Home Value in this Area
Purchase History
| Date | Buyer | Sale Price | Title Company |
|---|---|---|---|
| Brockmeyer Brigg J | $242,500 | Midland Celtic Title | |
| Harkey Gary C | $169,000 | -- | |
| -- | $106,000 | -- |
Source: Public Records
Mortgage History
| Date | Status | Borrower | Loan Amount |
|---|---|---|---|
| Open | Brockmeyer Brigg J | $206,100 | |
| Closed | Harkey Gary C | $160,550 |
Source: Public Records
Tax History
| Year | Tax Paid | Tax Assessment Tax Assessment Total Assessment is a certain percentage of the fair market value that is determined by local assessors to be the total taxable value of land and additions on the property. | Land | Improvement |
|---|---|---|---|---|
| 2025 | $12,822 | $221,480 | $116,970 | $104,510 |
| 2024 | $12,822 | $221,480 | $116,970 | $104,510 |
| 2023 | $12,663 | $221,480 | $116,970 | $104,510 |
| 2022 | $9,888 | $141,510 | $63,810 | $77,700 |
| 2021 | $8,753 | $141,510 | $63,810 | $77,700 |
| 2020 | $8,676 | $141,510 | $63,810 | $77,700 |
| 2019 | $8,801 | $126,920 | $63,810 | $63,110 |
| 2018 | $7,909 | $126,920 | $63,810 | $63,110 |
| 2017 | $7,937 | $126,920 | $63,810 | $63,110 |
| 2016 | $7,042 | $105,000 | $49,560 | $55,440 |
| 2015 | $7,036 | $105,000 | $49,560 | $55,440 |
| 2014 | $6,944 | $105,000 | $49,560 | $55,440 |
| 2013 | $3,365 | $95,445 | $45,045 | $50,400 |
Source: Public Records
Map
Nearby Homes
- 1921 Wyandotte Rd
- 1942 Bedford Rd
- 1951 Glenn Ave
- 1956 Glenn Ave
- 1876 Westwood Ave
- 1780 Waltham Rd
- 1810 Ashland Ave
- 1648 Ashland Ave
- 1632 Grenoble Rd
- 1624 Ashland Ave
- 1561 Glenn Ave
- 1845 Northwest Ct Unit D
- 2006 Cambridge Blvd
- 1775 Northwest Ct Unit 105
- 1790 Northwest Ct Unit F
- 1493 Chesapeake Ave
- 1799 Kings Ct Unit B
- 2112 Lower Chelsea Rd
- 2015 W 5th Ave Unit 104
- 2015 W 5th Ave Unit 103
- 1857 Andover Rd
- 1865 Andover Rd
- 1852 Bedford Rd
- 1858 Bedford Rd
- 1824 Tremont Rd
- 1868 Bedford Rd
- 1875 Andover Rd
- 1842 Andover Rd
- 1850 Andover Rd
- 1780 Tremont Rd
- 1856 Andover Rd
- 1876 Bedford Rd
- 1883 Andover Rd
- 1862 Andover Rd
- 1811 Tremont Rd
- 1884 Bedford Rd
- 1876 Andover Rd
- 1814 Andover Rd
- 1889 Andover Rd
- 1851 Bedford Rd
Your Personal Tour Guide
Ask me questions while you tour the home.