Estimated Value: $386,946 - $441,000
4
Beds
3
Baths
2,537
Sq Ft
$166/Sq Ft
Est. Value
About This Home
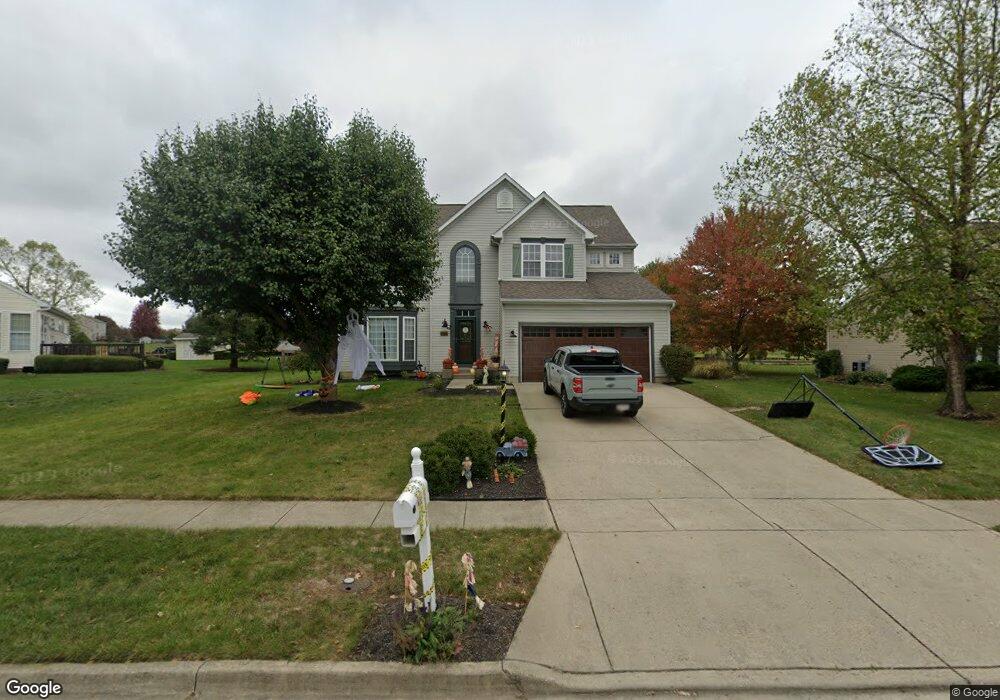
This home is located at 1845 Highlander Dr, Xenia, OH 45385 and is currently estimated at $421,737, approximately $166 per square foot. 1845 Highlander Dr is a home located in Greene County with nearby schools including Xenia High School.
Ownership History
Date
Name
Owned For
Owner Type
Purchase Details
Closed on
Oct 16, 2014
Sold by
Chavies John W and Chavies Tammy M
Bought by
Sears Matthew E and Sears Ashley L
Current Estimated Value
Home Financials for this Owner
Home Financials are based on the most recent Mortgage that was taken out on this home.
Original Mortgage
$206,055
Interest Rate
4.23%
Mortgage Type
New Conventional
Purchase Details
Closed on
Sep 30, 1999
Sold by
Nvr Inc
Bought by
Chavies John W and Chavies Tammy M
Home Financials for this Owner
Home Financials are based on the most recent Mortgage that was taken out on this home.
Original Mortgage
$137,000
Interest Rate
8.12%
Purchase Details
Closed on
Sep 28, 1999
Sold by
Arnold Development Inc
Bought by
Nvr Inc
Home Financials for this Owner
Home Financials are based on the most recent Mortgage that was taken out on this home.
Original Mortgage
$137,000
Interest Rate
8.12%
Purchase Details
Closed on
Jun 11, 1999
Sold by
Vonada John A and Vonada Damaine R
Bought by
Arnold Development Inc
Create a Home Valuation Report for This Property
The Home Valuation Report is an in-depth analysis detailing your home's value as well as a comparison with similar homes in the area
Home Values in the Area
Average Home Value in this Area
Purchase History
| Date | Buyer | Sale Price | Title Company |
|---|---|---|---|
| Sears Matthew E | $216,900 | None Available | |
| Sears Matthew L | $216,900 | Vantage Land Title | |
| Chavies John W | $180,100 | -- | |
| Nvr Inc | -- | -- | |
| Arnold Development Inc | $25,000 | -- |
Source: Public Records
Mortgage History
| Date | Status | Borrower | Loan Amount |
|---|---|---|---|
| Previous Owner | Sears Matthew L | $206,055 | |
| Previous Owner | Chavies John W | $137,000 | |
| Closed | Chavies John W | $25,000 |
Source: Public Records
Tax History Compared to Growth
Tax History
| Year | Tax Paid | Tax Assessment Tax Assessment Total Assessment is a certain percentage of the fair market value that is determined by local assessors to be the total taxable value of land and additions on the property. | Land | Improvement |
|---|---|---|---|---|
| 2024 | $4,512 | $105,440 | $15,350 | $90,090 |
| 2023 | $4,512 | $105,440 | $15,350 | $90,090 |
| 2022 | $3,863 | $77,000 | $9,590 | $67,410 |
| 2021 | $3,915 | $77,000 | $9,590 | $67,410 |
| 2020 | $3,751 | $77,000 | $9,590 | $67,410 |
| 2019 | $3,707 | $71,640 | $8,660 | $62,980 |
| 2018 | $3,722 | $71,640 | $8,660 | $62,980 |
| 2017 | $3,614 | $71,640 | $8,660 | $62,980 |
| 2016 | $3,639 | $68,740 | $8,660 | $60,080 |
| 2015 | $3,649 | $68,740 | $8,660 | $60,080 |
| 2014 | $3,398 | $68,740 | $8,660 | $60,080 |
Source: Public Records
Map
Nearby Homes
- 983 Echo Ct
- 1059 Apollo Dr
- 335 Winding Trail
- 1311 Eagles Way
- 1292 Joyce Dr
- 656 Eden Roc Dr
- 1030 Lark Ln
- 610 Saxony Dr
- 513 Redbud Ln
- 508 Marshall Dr
- 568 Louise Dr
- 1614 N Detroit St
- 1038 Frederick Dr
- 1171 N Detroit St
- 15 Sexton Dr
- 0 Us 42 Unit 941174
- 00 N Patton St
- 0 N Patton St
- 479 N Stadium Dr
- 1112 N Detroit St
- 1837 Highlander Dr
- 1751 Highlander Dr
- 1041 Brooke Ln
- 1071 Brooke Ln
- 1017 Brooke Ln
- 1808 Highlander Dr
- 1829 Highlander Dr
- 1834 Highlander Dr
- 1826 Highlander Dr
- 1821 Highlander Dr
- 1865 Highlander Dr
- 1861 Granada Way
- 1818 Highlander Dr
- 1050 Brooke Ln
- 992 Brooke Ln
- 1809 Highlander Dr
- 1810 Highlander Dr
- 1047 Brooke Ln
- 1873 Highlander Dr
- 1870 Highlander Dr