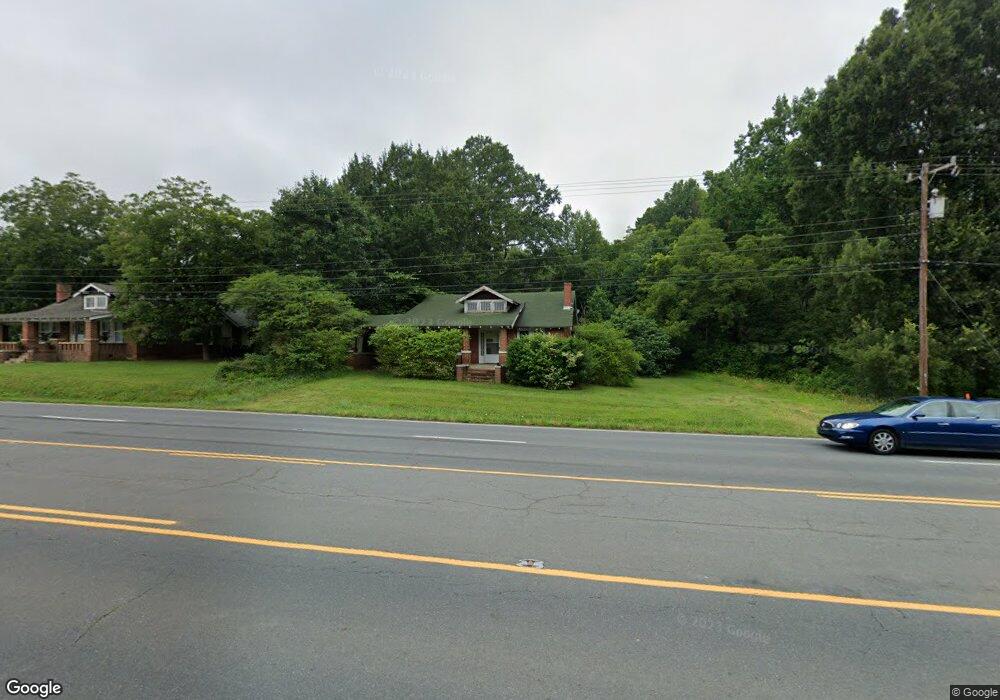
1845 N Main St China Grove, NC 28023
Estimated Value: $232,000 - $302,000
--
Bed
2
Baths
1,456
Sq Ft
$182/Sq Ft
Est. Value
About This Home
This home is located at 1845 N Main St, China Grove, NC 28023 and is currently estimated at $265,695, approximately $182 per square foot. 1845 N Main St is a home located in Rowan County with nearby schools including China Grove Elementary School, China Grove Middle School, and Jesse C Carson High School.
Ownership History
Date
Name
Owned For
Owner Type
Purchase Details
Closed on
Mar 2, 2004
Sold by
Brown Viola
Bought by
Smith Marshall A and Smith Deborah A
Current Estimated Value
Home Financials for this Owner
Home Financials are based on the most recent Mortgage that was taken out on this home.
Original Mortgage
$32,000
Outstanding Balance
$14,913
Interest Rate
5.63%
Mortgage Type
Purchase Money Mortgage
Estimated Equity
$250,782
Create a Home Valuation Report for This Property
The Home Valuation Report is an in-depth analysis detailing your home's value as well as a comparison with similar homes in the area
Home Values in the Area
Average Home Value in this Area
Purchase History
| Date | Buyer | Sale Price | Title Company |
|---|---|---|---|
| Smith Marshall A | $40,000 | -- |
Source: Public Records
Mortgage History
| Date | Status | Borrower | Loan Amount |
|---|---|---|---|
| Open | Smith Marshall A | $32,000 |
Source: Public Records
Tax History Compared to Growth
Tax History
| Year | Tax Paid | Tax Assessment Tax Assessment Total Assessment is a certain percentage of the fair market value that is determined by local assessors to be the total taxable value of land and additions on the property. | Land | Improvement |
|---|---|---|---|---|
| 2025 | $1,415 | $211,132 | $38,280 | $172,852 |
| 2024 | $1,415 | $211,132 | $38,280 | $172,852 |
| 2023 | $1,415 | $211,132 | $38,280 | $172,852 |
| 2022 | $912 | $121,946 | $31,320 | $90,626 |
| 2021 | $905 | $121,946 | $31,320 | $90,626 |
| 2020 | $905 | $121,946 | $31,320 | $90,626 |
| 2019 | $905 | $121,946 | $31,320 | $90,626 |
| 2018 | $802 | $109,056 | $31,320 | $77,736 |
| 2017 | $802 | $109,056 | $31,320 | $77,736 |
| 2016 | $802 | $109,056 | $31,320 | $77,736 |
| 2015 | $815 | $109,056 | $31,320 | $77,736 |
| 2014 | $802 | $112,671 | $31,320 | $81,351 |
Source: Public Records
Map
Nearby Homes
- 1675 N Main St
- 400 Black Bear St Unit 154p
- Winslow Plan at Kensington
- Hudson Plan at Kensington
- Gideon Plan at Kensington
- Jasper Plan at Kensington
- Vale Plan at Kensington
- Wakefield Plan at Kensington
- Kipling Plan at Kensington
- TA4000 Plan at Kensington
- Lenox Plan at Kensington
- TA3000 Plan at Kensington
- Declan Plan at Kensington
- Bayside Plan at Kensington
- Montcrest Plan at Kensington
- Devin Plan at Kensington
- 535 Black Bear St
- 535 Black Bear St Unit 163
- 0 Shue Rd
- 6255 Meadow Ln