Estimated Value: $368,000 - $554,000
3
Beds
2
Baths
1,991
Sq Ft
$236/Sq Ft
Est. Value
About This Home
This home is located at 1845 Old 35, Xenia, OH 45385 and is currently estimated at $470,836, approximately $236 per square foot. 1845 Old 35 is a home with nearby schools including Xenia High School.
Ownership History
Date
Name
Owned For
Owner Type
Purchase Details
Closed on
Aug 29, 2014
Sold by
Ferguson Courtney M
Bought by
Ferguson Courtney M and Ashworth Samuel M
Current Estimated Value
Home Financials for this Owner
Home Financials are based on the most recent Mortgage that was taken out on this home.
Original Mortgage
$179,000
Outstanding Balance
$129,381
Interest Rate
2.87%
Mortgage Type
Adjustable Rate Mortgage/ARM
Estimated Equity
$341,455
Purchase Details
Closed on
May 13, 2014
Sold by
Lee Charles Don and Lee Charles Donald
Bought by
Ferguson Courtney M
Create a Home Valuation Report for This Property
The Home Valuation Report is an in-depth analysis detailing your home's value as well as a comparison with similar homes in the area
Purchase History
| Date | Buyer | Sale Price | Title Company |
|---|---|---|---|
| Ferguson Courtney M | -- | None Available | |
| Ferguson Courtney M | -- | None Available |
Source: Public Records
Mortgage History
| Date | Status | Borrower | Loan Amount |
|---|---|---|---|
| Open | Ferguson Courtney M | $179,000 |
Source: Public Records
Tax History
| Year | Tax Paid | Tax Assessment Tax Assessment Total Assessment is a certain percentage of the fair market value that is determined by local assessors to be the total taxable value of land and additions on the property. | Land | Improvement |
|---|---|---|---|---|
| 2025 | $6,077 | $123,980 | $30,010 | $93,970 |
| 2024 | $6,077 | $123,980 | $30,010 | $93,970 |
| 2023 | $6,026 | $123,980 | $30,010 | $93,970 |
| 2022 | $4,468 | $83,310 | $21,430 | $61,880 |
| 2021 | $4,525 | $77,800 | $21,430 | $56,370 |
| 2020 | $4,060 | $77,800 | $21,430 | $56,370 |
| 2019 | $4,060 | $73,030 | $19,890 | $53,140 |
| 2018 | $4,074 | $73,030 | $19,890 | $53,140 |
| 2017 | $3,948 | $73,030 | $19,890 | $53,140 |
| 2016 | $3,948 | $69,580 | $18,910 | $50,670 |
| 2015 | $3,020 | $39,600 | $16,810 | $22,790 |
Source: Public Records
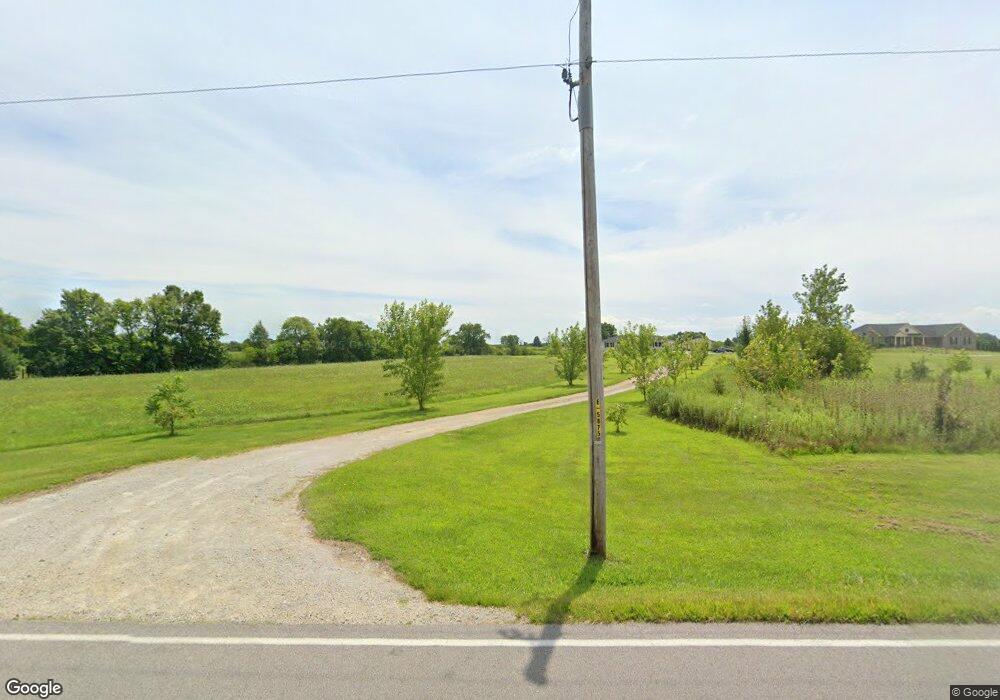
Map
Nearby Homes
- 0 Hickman Rd
- 414 S Monroe Siding Rd
- 1287 Brush Row Rd
- 1359 E Hoop Rd
- 1841 Marbella Ct
- 1823 Marbella Ct
- 1764 Highlander Dr
- 1818 Highlander Dr
- 1065 Clover Ct
- 1020 Brooke Ln
- 0 N Patton St
- 00 N Patton St
- 846 E Church St
- 832 E 3rd St
- 711 Doral Dr
- 1030 Independence Dr
- 645 E Church St
- 637 E Main St
- 607 E Main St
- 613 E 2nd St
Your Personal Tour Guide
Ask me questions while you tour the home.