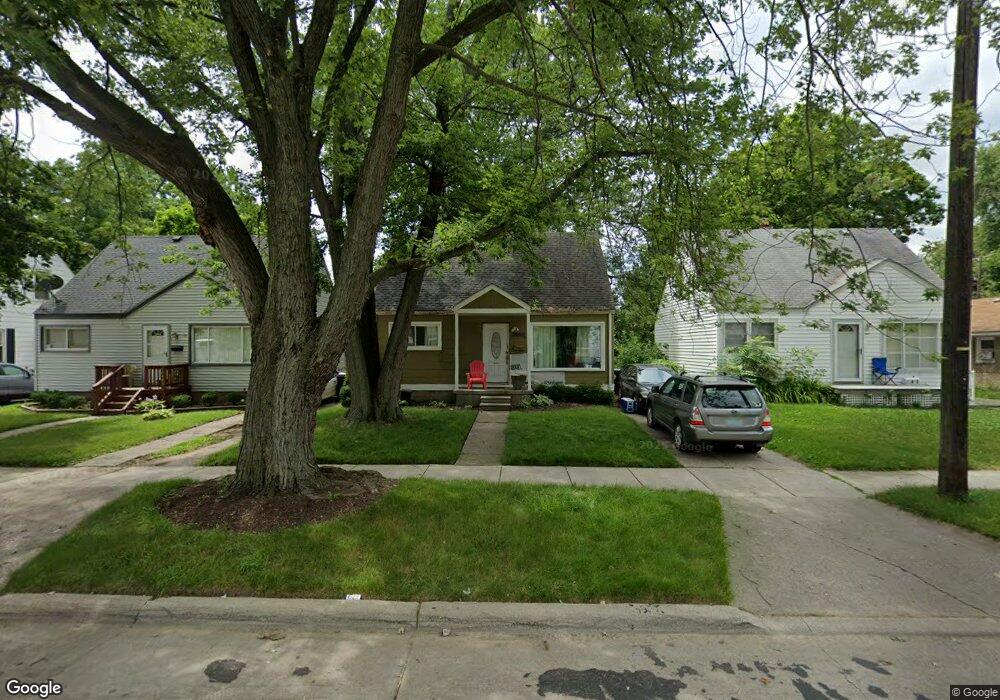
18457 Sumner Redford, MI 48240
Estimated Value: $110,000 - $158,000
3
Beds
1
Bath
714
Sq Ft
$195/Sq Ft
Est. Value
About This Home
This home is located at 18457 Sumner, Redford, MI 48240 and is currently estimated at $139,405, approximately $195 per square foot. 18457 Sumner is a home located in Wayne County with nearby schools including Beech Elementary School, Hilbert Elementary School, and David Ellis Academy West.
Ownership History
Date
Name
Owned For
Owner Type
Purchase Details
Closed on
Aug 19, 2011
Sold by
Newman Corine and Blair Christopher A
Bought by
Snyder Ryan C
Current Estimated Value
Purchase Details
Closed on
Sep 1, 2010
Sold by
Abrahams Sem and Abrahams Teresa
Bought by
Federal Home Loan Mortgage Corp
Purchase Details
Closed on
Apr 23, 2004
Sold by
Bird Roger L and Bird Michele R
Bought by
Abrahams Sem
Purchase Details
Closed on
Sep 30, 1997
Sold by
Dora Gerald K and Dora Jennifer
Bought by
Bird Michele R and Bird Roger L
Create a Home Valuation Report for This Property
The Home Valuation Report is an in-depth analysis detailing your home's value as well as a comparison with similar homes in the area
Home Values in the Area
Average Home Value in this Area
Purchase History
| Date | Buyer | Sale Price | Title Company |
|---|---|---|---|
| Snyder Ryan C | $15,000 | First Centennial Title Inc | |
| Federal Home Loan Mortgage Corp | $83,249 | None Available | |
| Abrahams Sem | $105,000 | -- | |
| Bird Michele R | $74,000 | -- |
Source: Public Records
Tax History
| Year | Tax Paid | Tax Assessment Tax Assessment Total Assessment is a certain percentage of the fair market value that is determined by local assessors to be the total taxable value of land and additions on the property. | Land | Improvement |
|---|---|---|---|---|
| 2025 | $612 | $60,400 | $0 | $0 |
| 2024 | $595 | $55,300 | $0 | $0 |
| 2023 | $568 | $45,200 | $0 | $0 |
| 2022 | $2,055 | $39,000 | $0 | $0 |
| 2021 | $2,063 | $35,400 | $0 | $0 |
| 2020 | $2,047 | $29,300 | $0 | $0 |
| 2019 | $1,380 | $27,300 | $0 | $0 |
| 2018 | $512 | $20,500 | $0 | $0 |
| 2017 | $1,954 | $19,800 | $0 | $0 |
| 2016 | $1,410 | $20,100 | $0 | $0 |
| 2015 | $1,839 | $18,400 | $0 | $0 |
| 2013 | $1,830 | $19,000 | $0 | $0 |
| 2012 | $1,267 | $21,400 | $6,100 | $15,300 |
Source: Public Records
Map
Nearby Homes
Your Personal Tour Guide
Ask me questions while you tour the home.