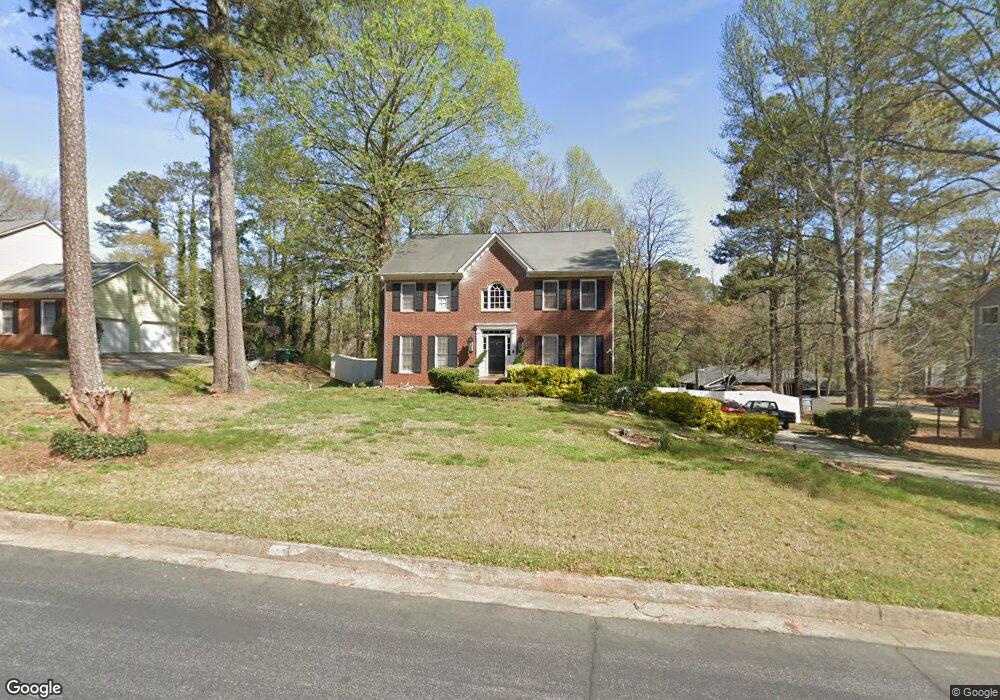
1846 Coventry Way Unit 9 Jonesboro, GA 30236
Estimated Value: $299,695 - $374,000
4
Beds
3
Baths
2,652
Sq Ft
$121/Sq Ft
Est. Value
About This Home
This home is located at 1846 Coventry Way Unit 9, Jonesboro, GA 30236 and is currently estimated at $320,174, approximately $120 per square foot. 1846 Coventry Way Unit 9 is a home located in Clayton County with nearby schools including James Jackson Elementary School, Jonesboro Middle School, and Jonesboro High School.
Ownership History
Date
Name
Owned For
Owner Type
Purchase Details
Closed on
Aug 8, 2017
Sold by
Augustin Raymond H
Bought by
Augustin Randolph Henri
Current Estimated Value
Purchase Details
Closed on
Aug 31, 2010
Sold by
Augustin Raymond H and Augustin Yvrose
Bought by
Augustin Raymond H and Augustin Randolph H
Purchase Details
Closed on
Oct 19, 2001
Sold by
George James and George Teresa
Bought by
Augustin Raymond H and Augustin Yvrose
Home Financials for this Owner
Home Financials are based on the most recent Mortgage that was taken out on this home.
Original Mortgage
$161,334
Interest Rate
6.85%
Mortgage Type
FHA
Purchase Details
Closed on
Aug 14, 1998
Sold by
Worley David J and Drankowski Bern
Bought by
George James and George Teresa
Home Financials for this Owner
Home Financials are based on the most recent Mortgage that was taken out on this home.
Original Mortgage
$120,700
Interest Rate
6.91%
Mortgage Type
New Conventional
Create a Home Valuation Report for This Property
The Home Valuation Report is an in-depth analysis detailing your home's value as well as a comparison with similar homes in the area
Home Values in the Area
Average Home Value in this Area
Purchase History
| Date | Buyer | Sale Price | Title Company |
|---|---|---|---|
| Augustin Randolph Henri | -- | -- | |
| Augustin Raymond H | -- | -- | |
| Augustin Raymond H | $163,900 | -- | |
| George James | $150,900 | -- |
Source: Public Records
Mortgage History
| Date | Status | Borrower | Loan Amount |
|---|---|---|---|
| Previous Owner | Augustin Raymond H | $161,334 | |
| Previous Owner | George James | $120,700 |
Source: Public Records
Tax History Compared to Growth
Tax History
| Year | Tax Paid | Tax Assessment Tax Assessment Total Assessment is a certain percentage of the fair market value that is determined by local assessors to be the total taxable value of land and additions on the property. | Land | Improvement |
|---|---|---|---|---|
| 2024 | $5,568 | $141,760 | $10,400 | $131,360 |
| 2023 | $4,627 | $128,160 | $10,400 | $117,760 |
| 2022 | $4,074 | $102,840 | $10,400 | $92,440 |
| 2021 | $3,544 | $88,760 | $10,400 | $78,360 |
| 2020 | $3,131 | $77,338 | $10,400 | $66,938 |
| 2019 | $3,095 | $75,312 | $9,200 | $66,112 |
| 2018 | $2,926 | $71,129 | $9,200 | $61,929 |
| 2017 | $2,146 | $61,794 | $9,200 | $52,594 |
| 2016 | $1,978 | $57,669 | $9,200 | $48,469 |
| 2015 | $1,744 | $0 | $0 | $0 |
| 2014 | $1,663 | $50,835 | $9,200 | $41,635 |
Source: Public Records
Map
Nearby Homes
- 1837 Coventry Way
- 7621 Raleigh Ln
- 7672 Echo Ln
- 7620 Mount Zion Blvd
- 1904 Cades Cove
- 1938 Wrights Way
- 1753 Brenda Dr
- 7581 Livingston Dr
- 1699 Brenda Dr Unit 2
- 7972 Woods Ln Unit IX
- 1608 Bogota Way
- 7583 Sunstone Dr
- 1732 Winding Woods Ln
- 2238 Danver Ct
- 2115 Logan Dr
- 8033 Aloha Dr
- 7431 Battlecreek Ln
- 248 Commons Dr
- 2140 Indian Hill Rd
- 7942 Rand Rd
- 1858 Coventry Way
- 1834 Coventry Way
- 7747 Hampton Cove
- 7748 Hartford Ct Unit 2
- 1847 Coventry Way Unit 9
- 1855 Coventry Way
- 7736 Hartford Ct
- 0 Hartford Ct Unit 7408479
- 0 Hartford Ct Unit 7076604
- 7737 Hampton Cove
- 1825 Coventry Way
- 1865 Coventry Way
- 7754 Hampton Cove
- 7765 Hartford Ct
- 7757 Hartford Ct
- 7740 Hampton Cove
- 0 Hampton Cove Unit 8876707
- 0 Hampton Cove
- 7747 Hartford Ct
- 1815 Coventry Way