NOT LISTED FOR SALE

18461 Cowing Ct Homewood, IL 60430

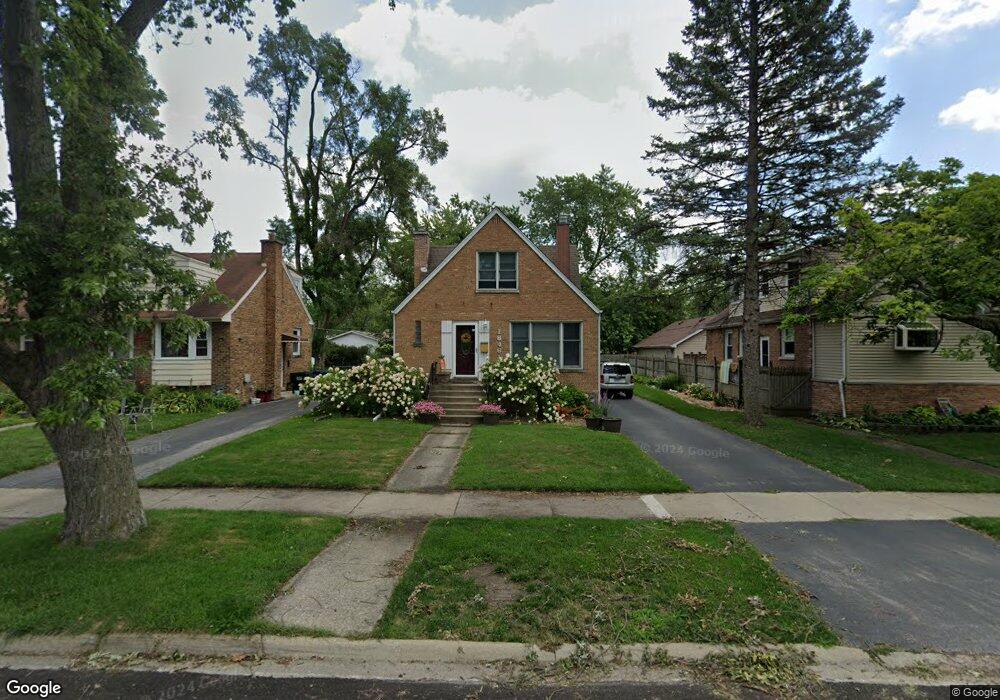
Estimated Value: $268,240 - $293,000

3 Beds
2 Baths
1,400 Sq Ft
$203/Sq Ft Est. Value

Last Sold October 29, 2013

Last sale price $155,000 $111 Per Sq Ft

Est. 83% increase in value since last sale

Current estimated payment $2,108/month

About This Home

As of October 2013

Perfectly maintained home in Southgate that has too many great features to list! Beautifully remodeled kitchen that has 42" cabinets, Corian counter tops, upgraded appliances and tons of space. Newer Anderson high efficient windows throughout home, hardwood floors throughout, new efficient furnace along with newer electrical wiring and hot water heater. This home is loved and you can tell.

Ownership History

Date Name Owned For Owner Type

Purchase Details

Listed on
Sep 15, 2013
Closed on
Oct 25, 2013
Sold by
Larocca Peter John and Larocca Linda Sue
Bought by
Schmidt Karyn A
Seller's Agent
Laura Boskelly
Keller Williams Elite
Buyer's Agent
John Flynn
Baird & Warner
List Price
$165,000
Sold Price
$155,000
Premium/Discount to List
-$10,000
-6.06%
Current Estimated Value
$283,560

Home Financials for this Owner

Home Financials are based on the most recent Mortgage that was taken out on this home.
Estimated Appreciation
$128,560
Avg. Annual Appreciation
5.17%
Source: Public Records

Range of Values:

Collateral Analytics

Collateral Analytics Collateral Analytics AVMs (Automated Valuation Model) employ a number of statistical approaches combined with neighborhood-specific comparable selection guarantees the most up-to-date and precise valuations.

Not Available

Collateral Analytics does not have data for the current month. Please view the chart for historical values.

ICE

ICE Mortgage Technology ICE Mortgage Technology’s AVM (Automated Valuation Model) is a state-of-the-art online residential property valuation tool that provides a quick and accurate estimate of the value of almost any home in the U.S.

Not Available

ICE Mortgage Technology does not have data for the current month. Please view the chart for historical values.

First American

First American First American Data & Analytics’ next-generation AVM combines unrivaled data assets with a blended ensemble of valuation models to produce highly accurate, reliable valuations you can trust.

Not Available

First American does not have data for the current month. Please view the chart for historical values.

Quantarium

Quantarium Quantarium’s valuation service, repeatedly proven the industry’s most accurate and comprehensive, is supercharged with a self-learning and auto-tuning AI engine that continually becomes smarter and more accurate as it processes daily inputs from the industry’s leading RE data lake.

Not Available

Quantarium does not have data for the current month. Please view the chart for historical values.

Average Value
Not Available
List Price
Sold Price
Create a Home Valuation Report for This Property
The Home Valuation Report is an in-depth analysis detailing your home's value as well as a comparison with similar homes in the area

Home Values in the Area

Source: Public Records

Average Home Value in this Area


Source: Public Records

Purchase History

Date Buyer Sale Price Title Company
Schmidt Karyn A $155,000 Fidelity National Title
Source: Public Records

Property History

Date Event Price List to Sale Price per Sq Ft Prior Sale
10/29/2013 10/29/13 Sold $155,000 -6.1% $111 / Sq Ft View Prior Sale
10/07/2013 10/07/13 Pending -- -- --
09/15/2013 09/15/13 For Sale $165,000 -- $118 / Sq Ft

Tax History Compared to Growth

Source: Public Records

Tax History

Year Tax Paid Tax Assessment Tax Assessment Total Assessment is a certain percentage of the fair market value that is determined by local assessors to be the total taxable value of land and additions on the property. Land Improvement
2024 $7,309 $21,000 $3,588 $17,412
2023 $5,600 $21,000 $3,588 $17,412
2022 $5,600 $14,246 $3,050 $11,196
2021 $5,266 $14,245 $3,049 $11,196
2020 $5,222 $14,245 $3,049 $11,196
2019 $4,205 $12,086 $2,691 $9,395
2018 $4,064 $12,086 $2,691 $9,395
2017 $5,287 $14,599 $2,691 $11,908
2016 $5,150 $13,177 $2,511 $10,666
2015 $5,052 $13,177 $2,511 $10,666
2014 $4,983 $13,177 $2,511 $10,666
2013 $5,933 $13,727 $2,511 $11,216
Source: Public Records

Agents Affiliated with this Home

  • Section Image
  • Section Image
See All Agents

Map