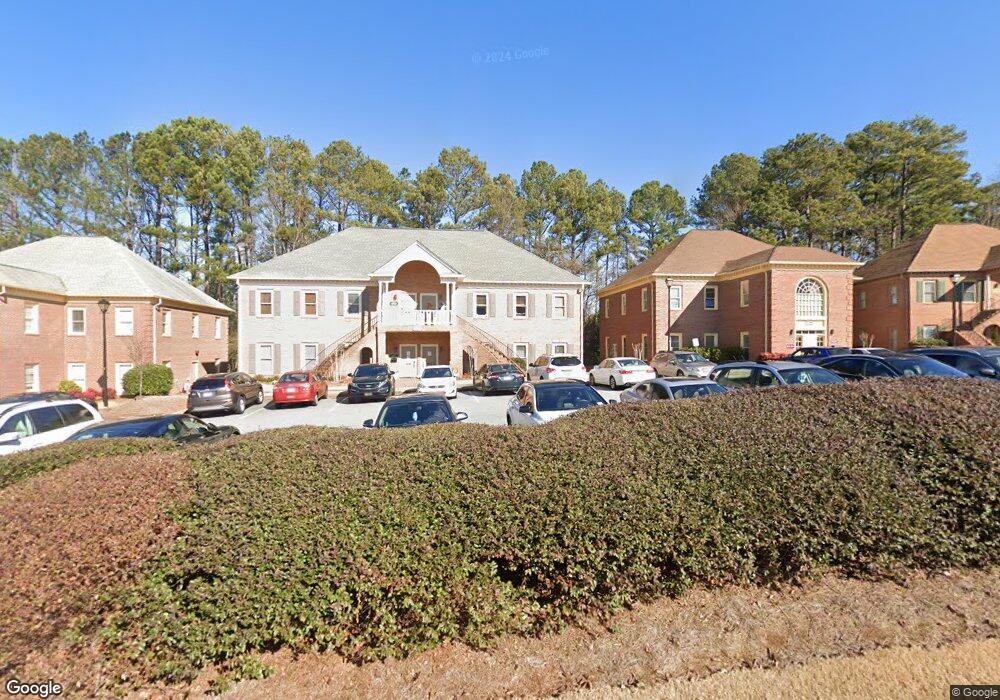
1848 Independence Square Atlanta, GA 30338
Estimated Value: $250,560
--
Bed
--
Bath
1,500
Sq Ft
$167/Sq Ft
Est. Value
About This Home
This home is located at 1848 Independence Square, Atlanta, GA 30338 and is currently estimated at $250,560, approximately $167 per square foot. 1848 Independence Square is a home located in DeKalb County with nearby schools including Dunwoody Elementary School, Peachtree Middle School, and Dunwoody High School.
Ownership History
Date
Name
Owned For
Owner Type
Purchase Details
Closed on
Jul 20, 2016
Bought by
K & L Properties Unlimited Llc
Current Estimated Value
Home Financials for this Owner
Home Financials are based on the most recent Mortgage that was taken out on this home.
Original Mortgage
$133,450
Outstanding Balance
$13,020
Interest Rate
3.56%
Mortgage Type
Commercial
Estimated Equity
$237,540
Purchase Details
Closed on
Jul 31, 2012
Sold by
Rekau Richard R
Bought by
Jerry Hannah Llc
Purchase Details
Closed on
Aug 28, 2009
Sold by
K & L Corporate Inc
Bought by
5 Even A Inc
Purchase Details
Closed on
Jan 20, 2005
Sold by
Equity Trust Co
Bought by
Rekau Richard R
Home Financials for this Owner
Home Financials are based on the most recent Mortgage that was taken out on this home.
Original Mortgage
$130,000
Interest Rate
5.68%
Mortgage Type
New Conventional
Purchase Details
Closed on
Aug 27, 2003
Sold by
Weekly Keith
Bought by
Equity Trust Co
Create a Home Valuation Report for This Property
The Home Valuation Report is an in-depth analysis detailing your home's value as well as a comparison with similar homes in the area
Home Values in the Area
Average Home Value in this Area
Purchase History
| Date | Buyer | Sale Price | Title Company |
|---|---|---|---|
| K & L Properties Unlimited Llc | $157,000 | -- | |
| Jerry Hannah Llc | $140,000 | -- | |
| 5 Even A Inc | $465,000 | -- | |
| Rekau Richard R | $167,500 | -- | |
| Equity Trust Co | $139,800 | -- | |
| Equity Trust Co Custodian | $127,000 | -- |
Source: Public Records
Mortgage History
| Date | Status | Borrower | Loan Amount |
|---|---|---|---|
| Open | K & L Properties Unlimited Llc | $133,450 | |
| Previous Owner | Rekau Richard R | $130,000 |
Source: Public Records
Tax History Compared to Growth
Tax History
| Year | Tax Paid | Tax Assessment Tax Assessment Total Assessment is a certain percentage of the fair market value that is determined by local assessors to be the total taxable value of land and additions on the property. | Land | Improvement |
|---|---|---|---|---|
| 2025 | $4,619 | $113,520 | $18,000 | $95,520 |
| 2024 | $3,620 | $113,520 | $18,000 | $95,520 |
| 2023 | $3,620 | $91,520 | $18,000 | $73,520 |
| 2022 | $3,075 | $77,015 | $18,000 | $59,015 |
| 2021 | $3,035 | $77,015 | $18,000 | $59,015 |
| 2020 | $3,092 | $77,015 | $18,000 | $59,015 |
| 2019 | $3,084 | $77,015 | $18,000 | $59,015 |
| 2018 | $2,542 | $61,920 | $18,000 | $43,920 |
| 2017 | $2,480 | $61,920 | $18,000 | $43,920 |
| 2016 | $2,437 | $61,920 | $18,000 | $43,920 |
| 2014 | $2,529 | $61,920 | $18,000 | $43,920 |
Source: Public Records
Map
Nearby Homes
- 4590 Village Oaks Cir
- 1931 Peeler Rd
- 4477 Village Dr
- 4955 Chamblee Dunwoody Rd
- 4333 Dunwoody Park Unit 2202
- 4333 Dunwoody Park Unit 2401
- 2256 Pernoshal Ct
- 2260 Pernoshal Ct
- 2271 Pernoshal Ct
- 2262 Pernoshal Ct
- 1850 Cotillion Dr Unit 3304
- 1850 Cotillion Dr Unit 4217
- 1850 Cotillion Dr Unit 2310
- 1850 Cotillion Dr Unit 1408
- 1850 Cotillion Dr Unit 4204
- 1850 Cotillion Dr Unit 1414
- 1850 Cotillion Dr Unit 3215
- 1848 Independence Square Unit C
- 1838 Independence Square Unit C
- 1838 Independence Square Unit D
- 1851 Village Mill Rd
- 1843 Village Mill Rd
- 1859 Village Mill Rd
- 1833 Village Mill Rd
- 1832 Independence Square
- 1869 Village Mill Rd
- 1832 Independence Square Unit D
- 1832 Independence Square Unit A
- 1876 Independence Square Unit D
- 1879 Village Mill Rd
- 1830 Independence Square Unit B
- 1818 Independence Square Unit D
- 1818 Independence Square Unit C
- 1813 Village Mill Rd
- 1885 Village Mill Rd
- 1850 Village Mill Rd
- 1860 Village Mill Rd