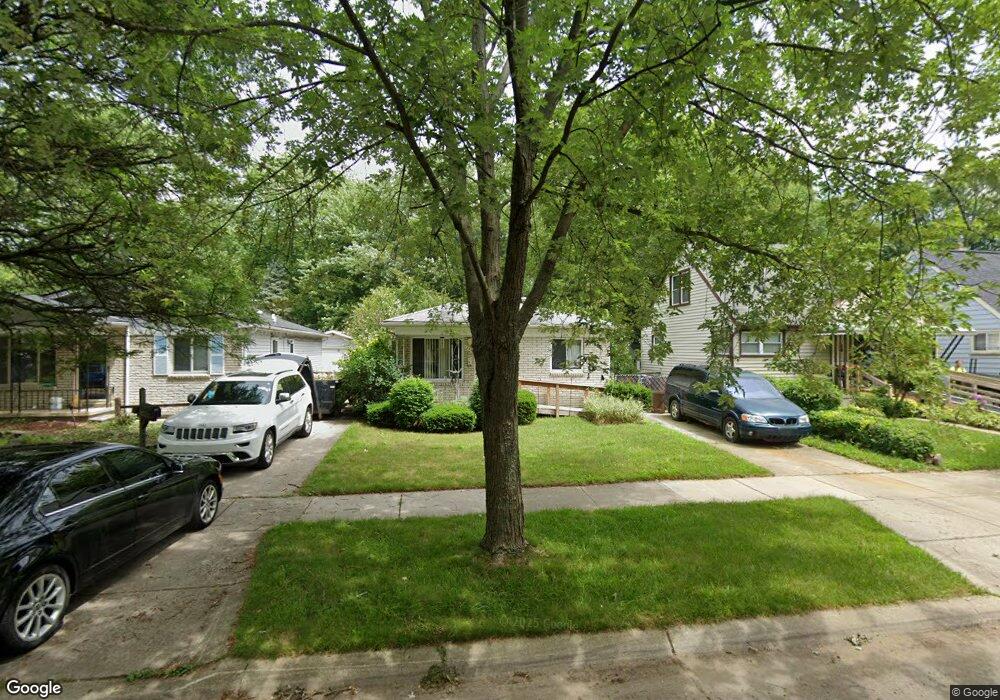
18482 Sumner Redford, MI 48240
Estimated Value: $110,000 - $147,000
Studio
1
Bath
960
Sq Ft
$136/Sq Ft
Est. Value
About This Home
This home is located at 18482 Sumner, Redford, MI 48240 and is currently estimated at $130,113, approximately $135 per square foot. 18482 Sumner is a home located in Wayne County with nearby schools including Beech Elementary School, Hilbert Elementary School, and David Ellis Academy West.
Ownership History
Date
Name
Owned For
Owner Type
Purchase Details
Closed on
Sep 8, 2022
Sold by
G & C Holdings Llc
Bought by
Robinson Daniel Jerome and Robinson Janee
Current Estimated Value
Home Financials for this Owner
Home Financials are based on the most recent Mortgage that was taken out on this home.
Original Mortgage
$95,136
Outstanding Balance
$90,699
Interest Rate
4.99%
Mortgage Type
FHA
Estimated Equity
$39,414
Purchase Details
Closed on
Jun 27, 2020
Sold by
Sibley Cheryl
Bought by
Gc Holdings Llc
Purchase Details
Closed on
Jan 25, 2019
Sold by
Sager Virginia D
Bought by
Sibley Cheryl
Create a Home Valuation Report for This Property
The Home Valuation Report is an in-depth analysis detailing your home's value as well as a comparison with similar homes in the area
Home Values in the Area
Average Home Value in this Area
Purchase History
| Date | Buyer | Sale Price | Title Company |
|---|---|---|---|
| Robinson Daniel Jerome | $110,000 | -- | |
| Gc Holdings Llc | -- | None Available | |
| Sibley Cheryl | $27,500 | Liberty Title |
Source: Public Records
Mortgage History
| Date | Status | Borrower | Loan Amount |
|---|---|---|---|
| Open | Robinson Daniel Jerome | $95,136 |
Source: Public Records
Tax History
| Year | Tax Paid | Tax Assessment Tax Assessment Total Assessment is a certain percentage of the fair market value that is determined by local assessors to be the total taxable value of land and additions on the property. | Land | Improvement |
|---|---|---|---|---|
| 2025 | $1,236 | $58,800 | $0 | $0 |
| 2024 | $1,202 | $53,800 | $0 | $0 |
| 2023 | $1,146 | $44,000 | $0 | $0 |
| 2022 | $2,576 | $38,000 | $0 | $0 |
| 2021 | $2,446 | $33,800 | $0 | $0 |
| 2020 | $2,413 | $27,900 | $0 | $0 |
| 2019 | $1,288 | $26,000 | $0 | $0 |
| 2018 | $472 | $19,000 | $0 | $0 |
| 2017 | $1,219 | $18,400 | $0 | $0 |
| 2016 | $1,072 | $18,500 | $0 | $0 |
| 2015 | $1,697 | $17,000 | $0 | $0 |
| 2013 | $1,680 | $17,500 | $0 | $0 |
| 2012 | $1,160 | $19,600 | $6,100 | $13,500 |
Source: Public Records
Map
Nearby Homes
Your Personal Tour Guide
Ask me questions while you tour the home.