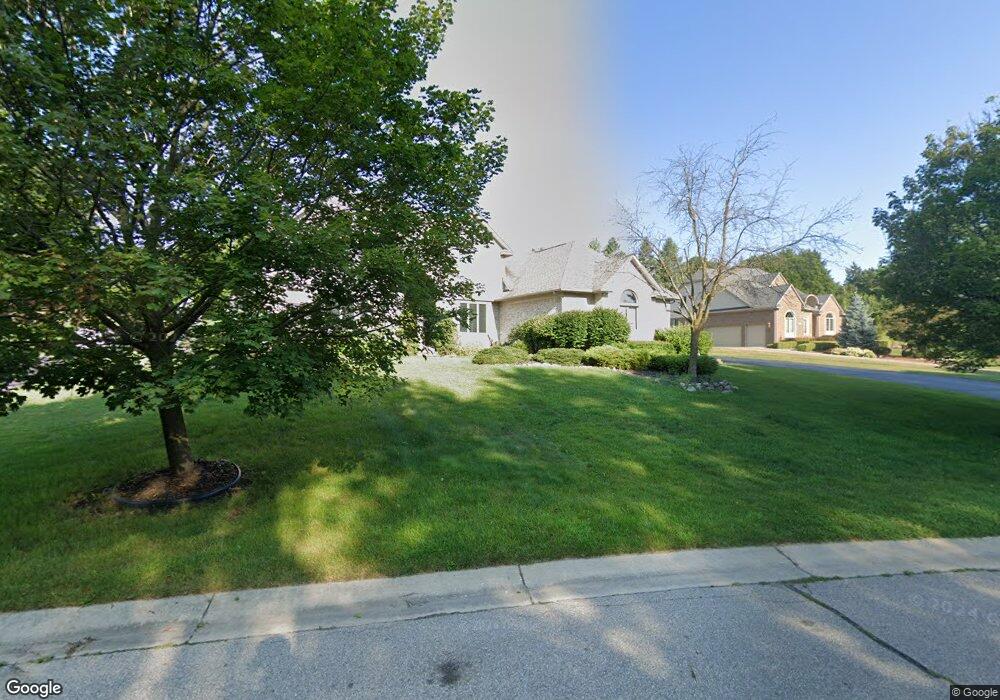
18489 Fox Hollow Ct Unit Bldg-Unit Northville, MI 48168
Estimated Value: $863,096 - $908,000
4
Beds
5
Baths
3,322
Sq Ft
$267/Sq Ft
Est. Value
About This Home
This home is located at 18489 Fox Hollow Ct Unit Bldg-Unit, Northville, MI 48168 and is currently estimated at $886,774, approximately $266 per square foot. 18489 Fox Hollow Ct Unit Bldg-Unit is a home located in Wayne County with nearby schools including Moraine Elementary School, Hillside Middle School, and Northville High School.
Ownership History
Date
Name
Owned For
Owner Type
Purchase Details
Closed on
Aug 3, 2022
Sold by
Wang and An-Li
Bought by
Tien Pei-Yu
Current Estimated Value
Purchase Details
Closed on
Jul 28, 2018
Sold by
Kim Dong Jun
Bought by
Wang Yi Kai and Hsu An Li
Home Financials for this Owner
Home Financials are based on the most recent Mortgage that was taken out on this home.
Original Mortgage
$250,000
Interest Rate
4.5%
Mortgage Type
New Conventional
Purchase Details
Closed on
Jun 1, 2016
Sold by
Kim Dong Jung and Han Hee Ok
Bought by
Kim Dong Jun
Home Financials for this Owner
Home Financials are based on the most recent Mortgage that was taken out on this home.
Original Mortgage
$270,000
Interest Rate
3.66%
Mortgage Type
New Conventional
Purchase Details
Closed on
Nov 27, 2013
Sold by
Adamczyk Jill and Adaczyk Bryon
Bought by
Kim Dong Jun
Purchase Details
Closed on
Sep 15, 2000
Sold by
Nottingham Partners Limi
Bought by
Adamczyk Bryon
Create a Home Valuation Report for This Property
The Home Valuation Report is an in-depth analysis detailing your home's value as well as a comparison with similar homes in the area
Home Values in the Area
Average Home Value in this Area
Purchase History
| Date | Buyer | Sale Price | Title Company |
|---|---|---|---|
| Tien Pei-Yu | $730,000 | None Listed On Document | |
| Wang Yi Kai | $520,000 | None Available | |
| Kim Dong Jun | -- | Crossroads Title Agency | |
| Kim Dong Jun | $510,000 | Capital Title Ins Agency | |
| Adamczyk Bryon | $113,500 | -- |
Source: Public Records
Mortgage History
| Date | Status | Borrower | Loan Amount |
|---|---|---|---|
| Previous Owner | Wang Yi Kai | $250,000 | |
| Previous Owner | Kim Dong Jun | $270,000 |
Source: Public Records
Tax History Compared to Growth
Tax History
| Year | Tax Paid | Tax Assessment Tax Assessment Total Assessment is a certain percentage of the fair market value that is determined by local assessors to be the total taxable value of land and additions on the property. | Land | Improvement |
|---|---|---|---|---|
| 2025 | $9,805 | $350,800 | $0 | $0 |
| 2024 | $9,805 | $343,300 | $0 | $0 |
| 2023 | $9,350 | $306,800 | $0 | $0 |
| 2022 | $9,960 | $287,900 | $0 | $0 |
| 2021 | $9,804 | $269,900 | $0 | $0 |
| 2020 | $9,811 | $266,900 | $0 | $0 |
| 2019 | $9,928 | $270,000 | $0 | $0 |
| 2018 | $5,507 | $286,600 | $0 | $0 |
| 2017 | $7,529 | $288,000 | $0 | $0 |
| 2016 | $8,999 | $295,400 | $0 | $0 |
| 2015 | $24,912 | $256,800 | $0 | $0 |
| 2013 | $22,579 | $241,200 | $0 | $0 |
| 2012 | $7,181 | $223,200 | $35,900 | $187,300 |
Source: Public Records
Map
Nearby Homes
- 18401 Fox Hollow Ct
- 18939 Bella Vista Ct Unit 8
- 47043 Curtis Rd
- 17888 Beck Rd
- 17965 Beck Rd
- 18756 Marble Head Dr
- 47611 Manorwood Dr
- 18878 Oak Leaf Ln
- 18197 Shelley Pond Ct
- 18155 Peninsula Way
- 47103 Timberlane St
- 46150 7 Mile Rd
- 20249 Beacon Way
- 47550 6 Mile Rd
- 46995 W Main St
- 46094 Sunset St
- 46159 Sunset St
- 46351 W Main St
- 46090 Sunset St
- 46062 Sunset St
- 18489 Fox Hollow Ct
- 18467 Fox Hollow Ct
- 18505 Fox Hollow Ct
- 18443 Fox Hollow Ct
- 18533 Fox Hollow Ct
- 18551 Fox Hollow Ct
- 18425 Fox Hollow Ct
- 18426 Fox Hollow Ct
- 18579 Fox Hollow Ct
- 18590 Fox Hollow Ct
- 18437 Blue Heron Dr E Unit D
- 18437 Blue Heron Dr E Unit 4
- 18750 Beck Rd
- 47437 Blue Heron Ct
- 47415 Blue Heron Ct
- 18479 Blue Heron Dr E
- 18401 Fox Hollow Ct Unit Bldg-Unit
- 18593 Fox Hollow Ct Unit Bldg-Unit
- 18593 Fox Hollow Ct
- 18614 Fox Hollow Ct Unit Bldg-Unit