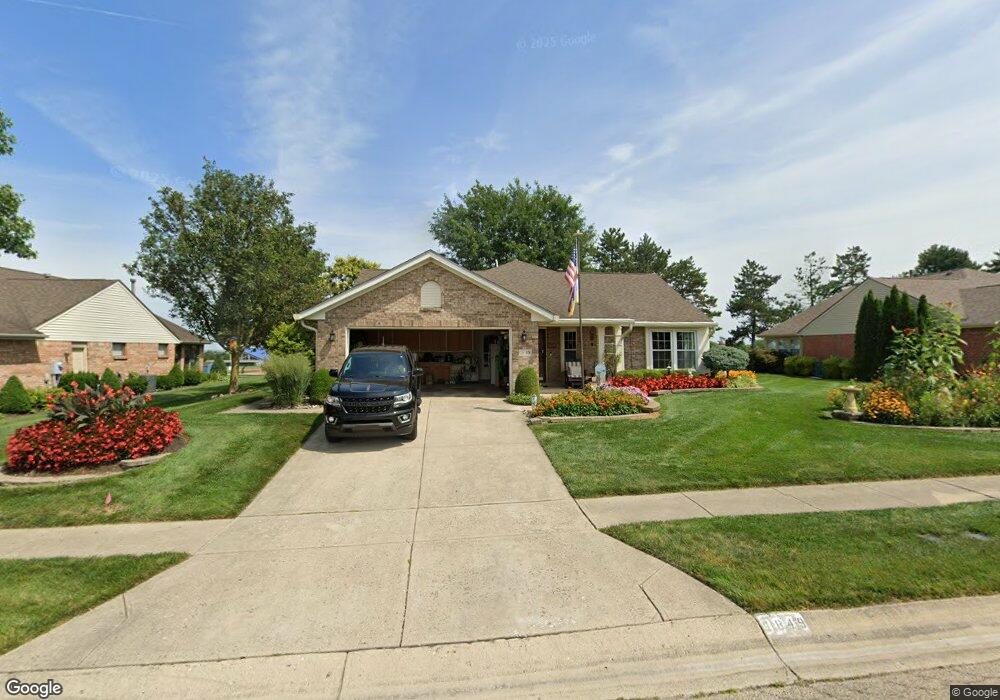
1849 Brandonhall Dr Miamisburg, OH 45342
Estimated Value: $291,000 - $344,000
3
Beds
2
Baths
1,786
Sq Ft
$175/Sq Ft
Est. Value
About This Home
This home is located at 1849 Brandonhall Dr, Miamisburg, OH 45342 and is currently estimated at $312,396, approximately $174 per square foot. 1849 Brandonhall Dr is a home located in Montgomery County with nearby schools including Miamisburg High School and Bethel Baptist School.
Ownership History
Date
Name
Owned For
Owner Type
Purchase Details
Closed on
Sep 27, 2018
Sold by
Angel Kay E
Bought by
Pearson Fay Janette and Pearson Boyd Darrell
Current Estimated Value
Home Financials for this Owner
Home Financials are based on the most recent Mortgage that was taken out on this home.
Original Mortgage
$165,000
Outstanding Balance
$143,890
Interest Rate
4.5%
Mortgage Type
New Conventional
Estimated Equity
$168,506
Purchase Details
Closed on
Jun 3, 2010
Sold by
Angel Kenneth G
Bought by
Angel Kenneth G
Purchase Details
Closed on
Oct 14, 2005
Sold by
Angel Kenneth G
Bought by
Angel Kenneth G and Kenneth G Angel Revocable Living Trust
Purchase Details
Closed on
Nov 14, 1997
Sold by
Angel Barbara A
Bought by
Angel Kenneth G
Purchase Details
Closed on
Aug 8, 1994
Sold by
Brandonhall Development Inc
Bought by
Angel Kenneth G and Angel Barbara A
Create a Home Valuation Report for This Property
The Home Valuation Report is an in-depth analysis detailing your home's value as well as a comparison with similar homes in the area
Home Values in the Area
Average Home Value in this Area
Purchase History
| Date | Buyer | Sale Price | Title Company |
|---|---|---|---|
| Pearson Fay Janette | $215,000 | Fidelity Lawyers Title Agenc | |
| Angel Kenneth G | -- | Attorney | |
| Angel Kenneth G | -- | -- | |
| Angel Kenneth G | -- | -- | |
| Angel Kenneth G | -- | -- |
Source: Public Records
Mortgage History
| Date | Status | Borrower | Loan Amount |
|---|---|---|---|
| Open | Pearson Fay Janette | $165,000 |
Source: Public Records
Tax History Compared to Growth
Tax History
| Year | Tax Paid | Tax Assessment Tax Assessment Total Assessment is a certain percentage of the fair market value that is determined by local assessors to be the total taxable value of land and additions on the property. | Land | Improvement |
|---|---|---|---|---|
| 2024 | $3,839 | $78,740 | $12,810 | $65,930 |
| 2023 | $3,839 | $78,740 | $12,810 | $65,930 |
| 2022 | $3,547 | $64,540 | $10,500 | $54,040 |
| 2021 | $3,137 | $64,540 | $10,500 | $54,040 |
| 2020 | $3,130 | $64,540 | $10,500 | $54,040 |
| 2019 | $3,095 | $60,170 | $10,500 | $49,670 |
| 2018 | $3,737 | $60,170 | $10,500 | $49,670 |
| 2017 | $3,711 | $60,170 | $10,500 | $49,670 |
| 2016 | $2,851 | $46,760 | $10,500 | $36,260 |
| 2015 | $2,796 | $46,760 | $10,500 | $36,260 |
| 2014 | $2,796 | $46,760 | $10,500 | $36,260 |
| 2012 | -- | $52,460 | $12,250 | $40,210 |
Source: Public Records
Map
Nearby Homes
- 1131 Castleton Ct
- 1734 Rosina Dr
- 2141 Rosina Dr
- 2127 Carrington Ln
- 1808 Burnside Dr
- 902 Althea Dr
- 1035 Woods View Ct
- 736 Decker Dr
- 807 Dunaway St
- 712 Decker Dr
- 766 Dunaway St
- 628 Jamestown Dr
- 00 Benner Rd
- 615 Burnside Dr
- 1157 Bonniebrook Dr
- 1013 S Heincke Rd
- 1826 Ashley Dr
- 2279 Rosina Dr
- 1045 S Linden Ave
- 1786 Ashley Dr
- 1855 Brandonhall Dr
- 1843 Brandonhall Dr
- 1837 Brandonhall Dr
- 1861 Brandonhall Dr
- 1848 Brandonhall Dr
- 1842 Brandonhall Dr
- 1854 Brandonhall Dr
- 1836 Brandonhall Dr
- 1831 Brandonhall Dr
- 1860 Brandonhall Dr
- 1830 Brandonhall Dr
- 1853 Rosina Dr
- 1825 Brandonhall Dr
- 1866 Brandonhall Dr
- 1847 Rosina Dr
- 1859 Rosina Dr
- 1824 Brandonhall Dr
- 1873 Brandonhall Dr
- 1841 Rosina Dr
- 1819 Brandonhall Dr