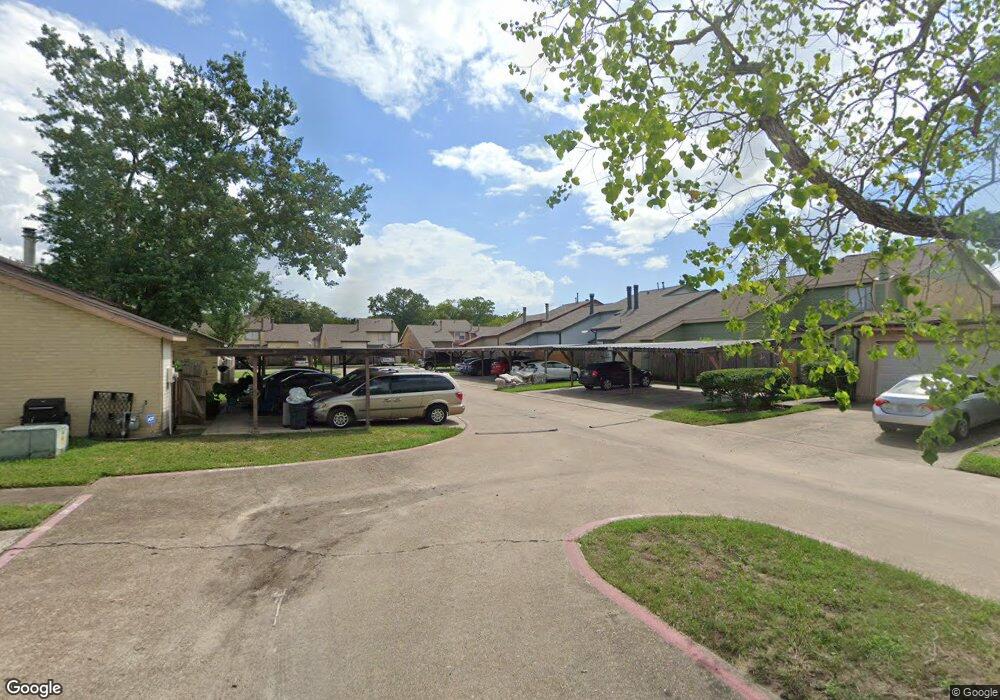
1849 Intercontinental Blvd Unit 19B Humble, TX 77338
Estimated Value: $116,000 - $121,000
2
Beds
2
Baths
1,186
Sq Ft
$100/Sq Ft
Est. Value
About This Home
This home is located at 1849 Intercontinental Blvd Unit 19B, Humble, TX 77338 and is currently estimated at $118,927, approximately $100 per square foot. 1849 Intercontinental Blvd Unit 19B is a home located in Harris County with nearby schools including Lakeland Elementary School, Ross Sterling Middle School, and Humble High School.
Ownership History
Date
Name
Owned For
Owner Type
Purchase Details
Closed on
May 30, 2025
Sold by
Carter Bernard
Bought by
Tanterra Waid Eboni
Current Estimated Value
Home Financials for this Owner
Home Financials are based on the most recent Mortgage that was taken out on this home.
Original Mortgage
$4,713
Interest Rate
6.83%
Purchase Details
Closed on
Dec 18, 1998
Sold by
Capital Research Group Inc
Bought by
Pestana Paul K and Pestana Sally A
Home Financials for this Owner
Home Financials are based on the most recent Mortgage that was taken out on this home.
Original Mortgage
$39,060
Interest Rate
6.85%
Purchase Details
Closed on
Jan 3, 1996
Sold by
Quinn Michael
Bought by
Sanderson J M
Purchase Details
Closed on
Oct 26, 1995
Sold by
John J Quinn Trust
Bought by
Sanderson J M
Create a Home Valuation Report for This Property
The Home Valuation Report is an in-depth analysis detailing your home's value as well as a comparison with similar homes in the area
Home Values in the Area
Average Home Value in this Area
Purchase History
| Date | Buyer | Sale Price | Title Company |
|---|---|---|---|
| Tanterra Waid Eboni | -- | Fidelity National Title | |
| Pestana Paul K | -- | American Title Co | |
| Sanderson J M | -- | -- | |
| Sanderson J M | -- | -- |
Source: Public Records
Mortgage History
| Date | Status | Borrower | Loan Amount |
|---|---|---|---|
| Closed | Tanterra Waid Eboni | $4,713 | |
| Open | Tanterra Waid Eboni | $117,826 | |
| Previous Owner | Pestana Paul K | $39,060 |
Source: Public Records
Tax History Compared to Growth
Tax History
| Year | Tax Paid | Tax Assessment Tax Assessment Total Assessment is a certain percentage of the fair market value that is determined by local assessors to be the total taxable value of land and additions on the property. | Land | Improvement |
|---|---|---|---|---|
| 2025 | $29 | $142,937 | $30,340 | $112,597 |
| 2024 | $29 | $137,056 | $30,340 | $106,716 |
| 2023 | $29 | $123,827 | $7,861 | $115,966 |
| 2022 | $2,247 | $102,690 | $7,861 | $94,829 |
| 2021 | $1,898 | $82,646 | $7,861 | $74,785 |
| 2020 | $1,897 | $79,080 | $7,861 | $71,219 |
| 2019 | $1,944 | $77,399 | $7,861 | $69,538 |
| 2018 | $961 | $63,225 | $7,861 | $55,364 |
| 2017 | $1,442 | $58,326 | $7,861 | $50,465 |
| 2016 | $1,442 | $58,326 | $7,861 | $50,465 |
| 2015 | $1,124 | $56,853 | $7,861 | $48,992 |
| 2014 | $1,124 | $45,622 | $7,861 | $37,761 |
Source: Public Records
Map
Nearby Homes
- 1907 Country Village Blvd Unit B
- 1941 Country Village Blvd Unit A
- 1859 Country Village Blvd Unit A
- 1877 Country Village Blvd Unit B
- 1831 Country Village Blvd
- 2071 Country Village Blvd Unit B
- 2071 Country Village Blvd Unit C
- 2037 Country Village Blvd Unit A
- 522 Charleston Square
- 506 Charleston Square
- 1809 Country Village Blvd
- 519 Sharon Dr
- TBD Farm To Market 1960 Rd E
- 8530 Farm To Market 1960 Rd E
- 502 Sammon Dr Unit 1-3
- 0 Fm 1960 Rd E Unit 93272527
- 1211 Main St
- 155 Davis St
- 144 Willow St Unit 1
- 1114 Wilson Rd
- 1849 Country Vlg Blvd Unit A
- 1849 Country Village Blvd Unit 18A
- 1849 Country Village Blvd Unit A
- 1859 Country Village Blvd Unit B
- 1859 Country Village Blvd Unit B&C
- 1859 Country Village Blvd Unit 17
- 1859 Country Village Blvd Unit 16 & 17
- 1859 Country Village Blvd Unit C
- 1857 Country Village Blvd
- 1857 Country Village Blvd Unit 4
- 1857 Country Village Blvd Unit D
- 1859 Country Village Blvd
- 1859 Country Village Blvd Unit C
- 1859 Country Vlg Blvd Unit A
- 1855 Country Village Blvd
- 1859 Intercontinental Blvd Unit 16
- 1891 B Intercontinental Blvd Unit 9B
- 1891 Intercontinental Blvd Unit 10A
- 1891 Intercontinental Blvd
- 1853 Country Village Blvd