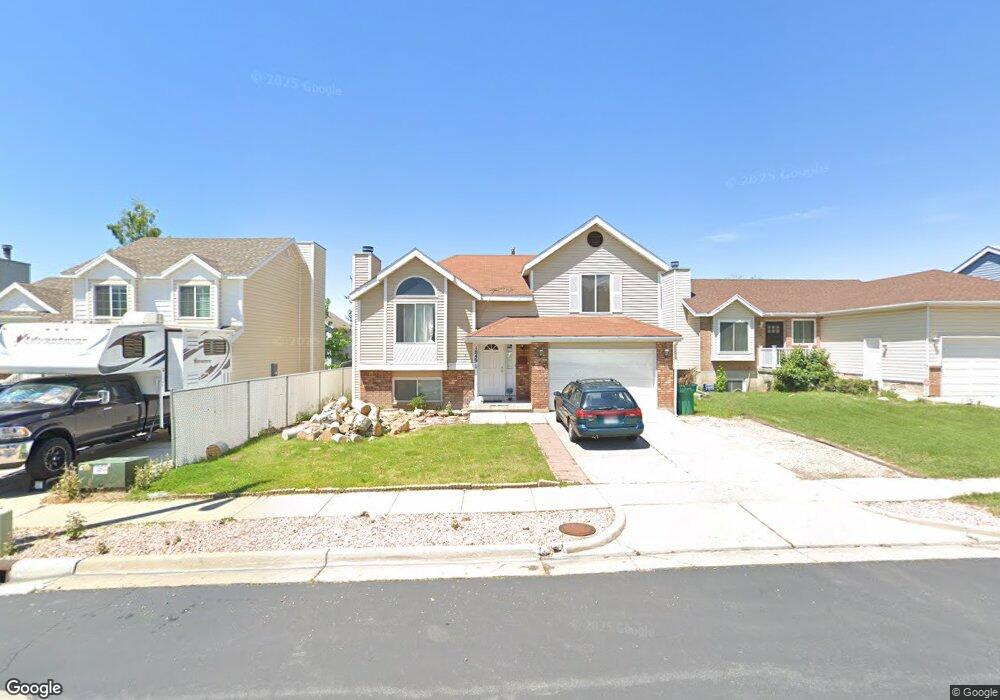
1849 N 285 W Layton, UT 84041
Estimated Value: $422,000 - $454,000
3
Beds
1
Bath
1,621
Sq Ft
$271/Sq Ft
Est. Value
About This Home
This home is located at 1849 N 285 W, Layton, UT 84041 and is currently estimated at $438,500, approximately $270 per square foot. 1849 N 285 W is a home located in Davis County with nearby schools including Lincoln Elementary School, North Layton Junior High School, and Northridge High School.
Ownership History
Date
Name
Owned For
Owner Type
Purchase Details
Closed on
Feb 16, 2007
Sold by
Crispi Teri and Crispi Alphonso
Bought by
Smalley Jodi
Current Estimated Value
Purchase Details
Closed on
Feb 15, 2007
Sold by
Smalley Jodi
Bought by
Smalley Jacob and Smalley Jodi M
Purchase Details
Closed on
Aug 23, 2006
Sold by
Engle Teri and Crispi Teri
Bought by
Crispi Alphonso and Crispi Teri
Purchase Details
Closed on
Dec 23, 2003
Sold by
Bank One Na
Bought by
Engle Teri
Home Financials for this Owner
Home Financials are based on the most recent Mortgage that was taken out on this home.
Original Mortgage
$127,647
Interest Rate
5.79%
Mortgage Type
VA
Purchase Details
Closed on
Sep 30, 2003
Sold by
Rasmussen Kerry and Rasmussen Lolita
Bought by
Bank One Na
Purchase Details
Closed on
Aug 24, 2000
Sold by
Chedalawada Cynthia S
Bought by
Rasmussen Kerry and Rasmussen Lolita
Create a Home Valuation Report for This Property
The Home Valuation Report is an in-depth analysis detailing your home's value as well as a comparison with similar homes in the area
Home Values in the Area
Average Home Value in this Area
Purchase History
| Date | Buyer | Sale Price | Title Company |
|---|---|---|---|
| Smalley Jodi | -- | First American Title | |
| Smalley Jacob | -- | Cottonwood Title Ins Agency | |
| Crispi Alphonso | -- | Accommodation | |
| Engle Teri | -- | Mountain View Title & Escrow | |
| Bank One Na | $106,250 | Inwest Title Services Inc | |
| Rasmussen Kerry | -- | First American Title Co |
Source: Public Records
Mortgage History
| Date | Status | Borrower | Loan Amount |
|---|---|---|---|
| Previous Owner | Engle Teri | $127,647 |
Source: Public Records
Tax History Compared to Growth
Tax History
| Year | Tax Paid | Tax Assessment Tax Assessment Total Assessment is a certain percentage of the fair market value that is determined by local assessors to be the total taxable value of land and additions on the property. | Land | Improvement |
|---|---|---|---|---|
| 2025 | $1,971 | $216,150 | $84,690 | $131,460 |
| 2024 | $1,971 | $208,450 | $99,632 | $108,818 |
| 2023 | $1,974 | $368,000 | $127,651 | $240,349 |
| 2022 | $1,989 | $201,300 | $64,702 | $136,598 |
| 2021 | $1,828 | $276,000 | $83,812 | $192,188 |
| 2020 | $1,650 | $239,000 | $73,386 | $165,614 |
| 2019 | $1,629 | $231,000 | $72,413 | $158,587 |
| 2018 | $1,454 | $207,000 | $72,413 | $134,587 |
| 2016 | $1,361 | $99,990 | $21,250 | $78,740 |
| 2015 | $1,304 | $90,915 | $21,250 | $69,665 |
| 2014 | $1,251 | $89,181 | $21,250 | $67,931 |
| 2013 | -- | $83,042 | $17,475 | $65,567 |
Source: Public Records
Map
Nearby Homes
- 247 W 1925 N
- 1837 N 440 W
- 1644 N 160 W
- 1966 N 50 W
- 2044 Evans Cove Loop
- 2048 Evans Cove Loop
- 1676 Forbes Ave W
- 2187 N 450 W
- 1490 N 175 W
- 2211 N 525 W
- 2248 N 500 W
- 23 E 2150 N
- 160 W 1350 N
- 1553 N 250 E
- 255 E 1500 N
- 2378 N 675 W
- 1474 N 285 E
- 2500 N Fort Ln Unit 238
- 2500 N Fort Ln Unit 189
- 2600 N Hill Field Rd Unit 4