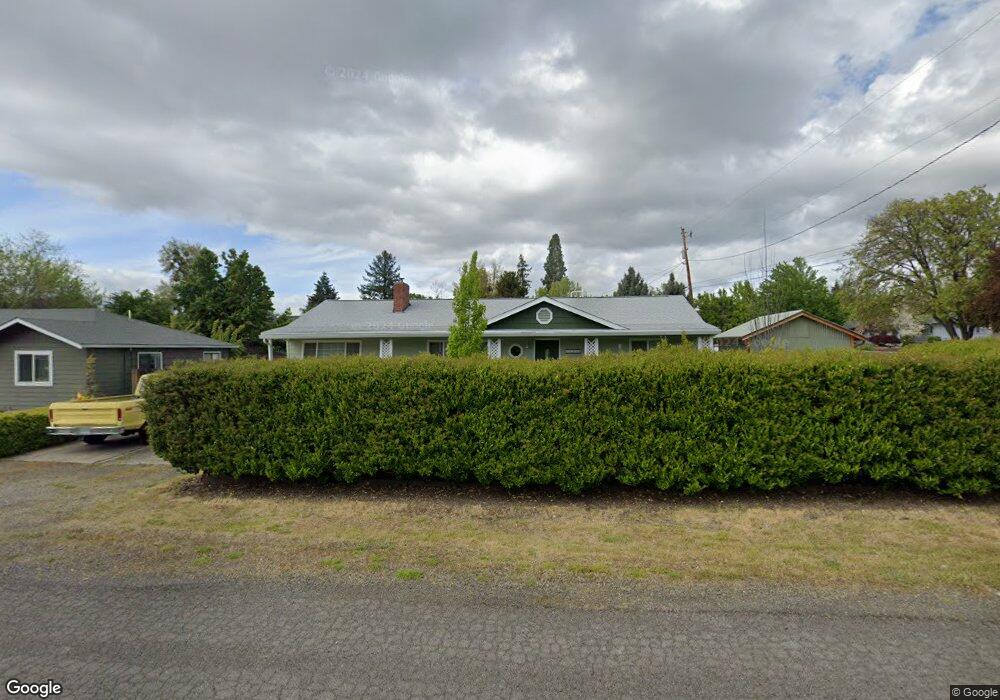
1849 Roxy Ann Place Medford, OR 97504
Estimated Value: $362,000 - $390,000
3
Beds
2
Baths
1,336
Sq Ft
$282/Sq Ft
Est. Value
About This Home
This home is located at 1849 Roxy Ann Place, Medford, OR 97504 and is currently estimated at $376,407, approximately $281 per square foot. 1849 Roxy Ann Place is a home located in Jackson County with nearby schools including Hoover Elementary School, Hedrick Middle School, and South Medford High School.
Ownership History
Date
Name
Owned For
Owner Type
Purchase Details
Closed on
Apr 28, 1998
Sold by
Dunbar Richard L
Bought by
Myers Larry E and Myers Patricia A
Current Estimated Value
Home Financials for this Owner
Home Financials are based on the most recent Mortgage that was taken out on this home.
Original Mortgage
$87,300
Outstanding Balance
$16,998
Interest Rate
7.06%
Estimated Equity
$359,409
Create a Home Valuation Report for This Property
The Home Valuation Report is an in-depth analysis detailing your home's value as well as a comparison with similar homes in the area
Home Values in the Area
Average Home Value in this Area
Purchase History
| Date | Buyer | Sale Price | Title Company |
|---|---|---|---|
| Myers Larry E | $104,000 | Jackson County Title |
Source: Public Records
Mortgage History
| Date | Status | Borrower | Loan Amount |
|---|---|---|---|
| Open | Myers Larry E | $87,300 |
Source: Public Records
Tax History Compared to Growth
Tax History
| Year | Tax Paid | Tax Assessment Tax Assessment Total Assessment is a certain percentage of the fair market value that is determined by local assessors to be the total taxable value of land and additions on the property. | Land | Improvement |
|---|---|---|---|---|
| 2025 | $2,733 | $188,420 | $86,160 | $102,260 |
| 2024 | $2,733 | $182,940 | $83,650 | $99,290 |
| 2023 | $2,649 | $177,620 | $81,210 | $96,410 |
| 2022 | $2,584 | $177,620 | $81,210 | $96,410 |
| 2021 | $2,518 | $172,450 | $78,850 | $93,600 |
| 2020 | $2,464 | $167,430 | $76,560 | $90,870 |
| 2019 | $2,406 | $157,830 | $72,180 | $85,650 |
| 2018 | $2,345 | $153,240 | $70,080 | $83,160 |
| 2017 | $2,302 | $153,240 | $70,080 | $83,160 |
| 2016 | $2,318 | $144,450 | $66,050 | $78,400 |
| 2015 | $2,228 | $144,450 | $66,050 | $78,400 |
| 2014 | $2,189 | $136,170 | $62,250 | $73,920 |
Source: Public Records
Map
Nearby Homes
- 433 Highland Dr
- 430 Highland Dr
- 341 Ardmore Ave
- 149 S Keene Way Dr
- 305 S Groveland Ave
- 17 Glen Oak Ct
- 317 Eastwood Dr
- 12 Glen Oak Ct
- 9 S Groveland Ave
- 1418 Appleton Cir
- 204 Mount Echo Dr
- 2233 Oakwood Dr
- 1924 Crestbrook Rd
- 1711 E Main St
- 425 S Modoc Ave
- 755 Ellendale Dr
- 302 Medford Heights Ln
- 1279 Maple Leaf Ct Unit 1C
- 1279 Maple Leaf Ct Unit 1A
- 101 S Modoc Ave
- 1841 Roxy Ann Place
- 308 Lynwood Ave
- 325 Lynnwood Ave
- 400 Lynnwood Ave
- 308 Lynnwood Ave
- 400 Lynnwood Ave
- 317 Lynnwood Ave
- 325 Lynwood Ave
- 317 Lynwood Ave
- 1840 Roxy Ann Place
- 1809 Roxy Ann Place
- 1844 Roxy Ann Place
- 333 Lynnwood Ave
- 524 S Keene Way Dr
- 333 Lynwood Ave
- 309 Lynwood Ave
- 300 Lynwood Ave
- 401 Lynnwood Ave
- 1808 Roxy Ann Place
- 349 Highland Dr