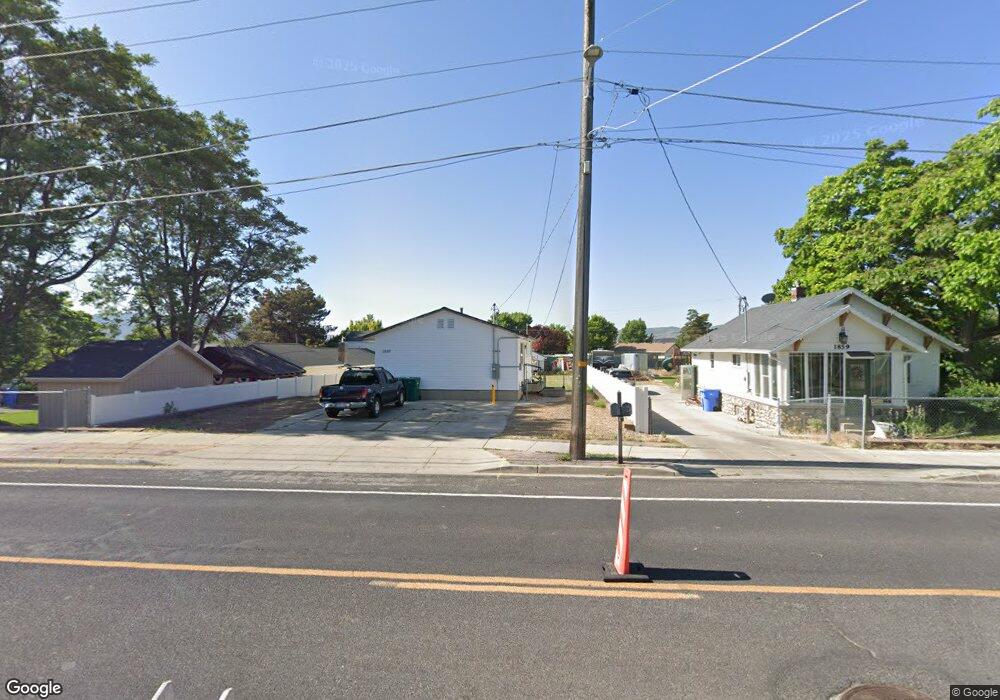
1849 W 11800 S Riverton, UT 84065
Estimated Value: $476,000 - $518,267
4
Beds
2
Baths
1,968
Sq Ft
$254/Sq Ft
Est. Value
About This Home
This home is located at 1849 W 11800 S, Riverton, UT 84065 and is currently estimated at $500,817, approximately $254 per square foot. 1849 W 11800 S is a home located in Salt Lake County with nearby schools including Rosamond Elementary School, Oquirrh Hills Middle School, and Riverton High School.
Ownership History
Date
Name
Owned For
Owner Type
Purchase Details
Closed on
Jul 11, 2024
Sold by
Win-Win Investments Llc
Bought by
1849Wr Llc
Current Estimated Value
Purchase Details
Closed on
Dec 21, 2021
Sold by
Michael White Joseph and Michael Alice M
Bought by
Win-Win Investments Llc
Home Financials for this Owner
Home Financials are based on the most recent Mortgage that was taken out on this home.
Original Mortgage
$152,306
Interest Rate
3.11%
Mortgage Type
New Conventional
Purchase Details
Closed on
Jan 6, 2017
Sold by
White Joseph
Bought by
Win Win Investmnent Llc
Home Financials for this Owner
Home Financials are based on the most recent Mortgage that was taken out on this home.
Original Mortgage
$161,250
Interest Rate
4.03%
Mortgage Type
New Conventional
Purchase Details
Closed on
Mar 3, 2014
Sold by
Tenney Jessica
Bought by
Win & Win Investments Llc
Home Financials for this Owner
Home Financials are based on the most recent Mortgage that was taken out on this home.
Original Mortgage
$127,000
Interest Rate
4.29%
Mortgage Type
Purchase Money Mortgage
Purchase Details
Closed on
Apr 22, 2011
Sold by
Jpmorgan Chase Bank National Association
Bought by
Tenney Jessica
Home Financials for this Owner
Home Financials are based on the most recent Mortgage that was taken out on this home.
Original Mortgage
$95,400
Interest Rate
4.72%
Mortgage Type
New Conventional
Purchase Details
Closed on
Oct 1, 2010
Sold by
Duncan Chad L
Bought by
Jpmorgan Chase Bank National Association
Purchase Details
Closed on
Jul 9, 1999
Sold by
Roe Terrill J and Roe Jennifer
Bought by
Duncan Chad L
Home Financials for this Owner
Home Financials are based on the most recent Mortgage that was taken out on this home.
Original Mortgage
$113,900
Interest Rate
7.64%
Purchase Details
Closed on
Apr 2, 1997
Sold by
Evans Robert M and Evans Barbara Ann
Bought by
Roe Terrill J and Roe Jennifer
Home Financials for this Owner
Home Financials are based on the most recent Mortgage that was taken out on this home.
Original Mortgage
$104,806
Interest Rate
7.56%
Mortgage Type
FHA
Create a Home Valuation Report for This Property
The Home Valuation Report is an in-depth analysis detailing your home's value as well as a comparison with similar homes in the area
Home Values in the Area
Average Home Value in this Area
Purchase History
| Date | Buyer | Sale Price | Title Company |
|---|---|---|---|
| 1849Wr Llc | -- | None Listed On Document | |
| Win-Win Investments Llc | -- | Vanguard Title | |
| White Joseph Michael | $202,566 | Vanguard Title | |
| White Joseph Michael | -- | Vanguard Title | |
| Win Win Investmnent Llc | -- | Richland Title Ins Agency In | |
| White Joseph | -- | Richland Title Ins Agency In | |
| Win & Win Investments Llc | -- | Richland Title Ins Agency In | |
| Tenney Jessica | -- | Security Title Ins Agency | |
| Jpmorgan Chase Bank National Association | $113,961 | None Available | |
| Duncan Chad L | -- | Backman Stewart Title Servic | |
| Roe Terrill J | -- | -- |
Source: Public Records
Mortgage History
| Date | Status | Borrower | Loan Amount |
|---|---|---|---|
| Previous Owner | White Joseph Michael | $152,306 | |
| Previous Owner | White Joseph | $161,250 | |
| Previous Owner | Win & Win Investments Llc | $127,000 | |
| Previous Owner | Tenney Jessica | $95,400 | |
| Previous Owner | Duncan Chad L | $113,900 | |
| Previous Owner | Roe Terrill J | $104,806 |
Source: Public Records
Tax History Compared to Growth
Tax History
| Year | Tax Paid | Tax Assessment Tax Assessment Total Assessment is a certain percentage of the fair market value that is determined by local assessors to be the total taxable value of land and additions on the property. | Land | Improvement |
|---|---|---|---|---|
| 2025 | $2,158 | $380,700 | $199,400 | $181,300 |
| 2024 | $2,158 | $373,500 | $195,700 | $177,800 |
| 2023 | $2,091 | $341,200 | $181,200 | $160,000 |
| 2022 | $2,182 | $349,200 | $177,700 | $171,500 |
| 2021 | $1,819 | $259,300 | $133,300 | $126,000 |
| 2020 | $1,466 | $194,800 | $119,400 | $75,400 |
| 2019 | $1,487 | $194,300 | $108,600 | $85,700 |
| 2018 | $1,425 | $183,300 | $108,600 | $74,700 |
| 2017 | $1,367 | $171,300 | $108,600 | $62,700 |
| 2016 | $1,264 | $152,000 | $98,700 | $53,300 |
| 2015 | $1,221 | $142,400 | $100,500 | $41,900 |
| 2014 | $1,250 | $134,000 | $95,800 | $38,200 |
Source: Public Records
Map
Nearby Homes
- 1767 W Lunford Ln
- 11666 S Gold Dust Dr
- 1721 W Hollow Cedar Ln Unit 1
- 1611 W Laurel Chase Dr
- 12034 S 1900 W
- 1592 W Andover Rd
- 2295 W Myers Ln
- 11707 S Myers Park Ln Unit 111
- 11423 S Polo Club Ct
- 11694 Stone Crest Cir
- 11788 S Myers Park Ln Unit 101
- 11711 Stone Crest Cir
- 1538 W Oakbrook Dr
- 11513 S Andover Rd
- 11784 Stone Ridge Ct
- 1661 W Madison View Dr
- 2511 W 11730 S
- 1337 Natasha Cir
- 1410 W 12115 S
- 11860 S Alysum Cir
- 1849 W Myers Ln
- 1849 Myers Ln
- 1859 W 11800 S
- 1839 Myers Ln
- 1859 Myers Ln
- 1865 Myers Ln
- 1865 W 11800 S
- 1825 W Myers Ln
- 1825 W 11800 S
- 1835 Myers Ln
- 11827 S 1900 W
- 1840 W Myers Ln
- 1887 Myers Ln
- 11834 S Pinnacle Acre Ct Unit 6
- 11834 S Pinnacle Acre Ct
- 1868 W 11860 S
- 11814 S Pinnacle Acre Ct Unit 1
- 11814 S Pinnacle Acre Ct Unit 2
- 11814 S Pinnacle Acre Ct
- 11831 S 1900 W