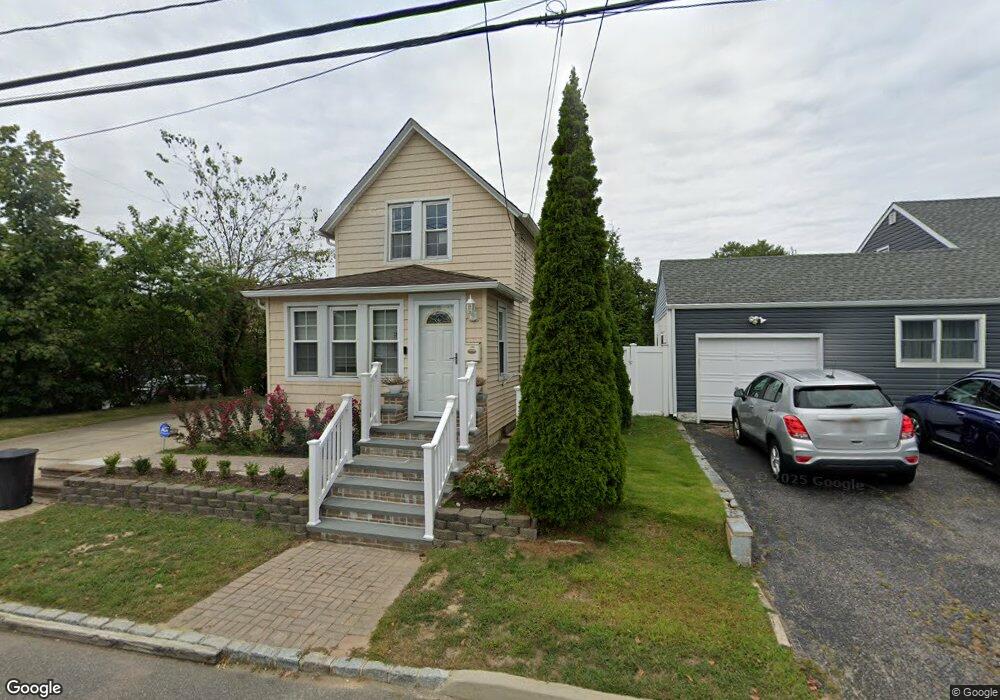
185 Albany Ave Lindenhurst, NY 11757
Estimated Value: $560,882 - $676,000
--
Bed
--
Bath
940
Sq Ft
$672/Sq Ft
Est. Value
About This Home
This home is located at 185 Albany Ave, Lindenhurst, NY 11757 and is currently estimated at $631,721, approximately $672 per square foot. 185 Albany Ave is a home located in Suffolk County with nearby schools including Albany Avenue Elementary School, Lindenhurst Middle School, and Lindenhurst Senior High School.
Ownership History
Date
Name
Owned For
Owner Type
Purchase Details
Closed on
Dec 11, 2003
Sold by
Javurek Robert and Javurek Julie
Bought by
Peterson David S and Peterson Carmen M
Current Estimated Value
Home Financials for this Owner
Home Financials are based on the most recent Mortgage that was taken out on this home.
Original Mortgage
$270,000
Outstanding Balance
$125,812
Interest Rate
5.96%
Mortgage Type
Purchase Money Mortgage
Estimated Equity
$505,909
Purchase Details
Closed on
Jan 14, 2000
Sold by
Ferrante Felicia and Dolan William
Bought by
Javurek Robert and Javurek Julie
Home Financials for this Owner
Home Financials are based on the most recent Mortgage that was taken out on this home.
Original Mortgage
$129,000
Interest Rate
7.91%
Purchase Details
Closed on
Dec 20, 1996
Sold by
Copeman Ellen M
Bought by
Dolan William and Ferrante Felicia
Create a Home Valuation Report for This Property
The Home Valuation Report is an in-depth analysis detailing your home's value as well as a comparison with similar homes in the area
Home Values in the Area
Average Home Value in this Area
Purchase History
| Date | Buyer | Sale Price | Title Company |
|---|---|---|---|
| Peterson David S | $270,000 | Commonwealth Title | |
| Javurek Robert | $137,000 | First American Title | |
| Dolan William | $103,000 | Fidelity National Title Ins |
Source: Public Records
Mortgage History
| Date | Status | Borrower | Loan Amount |
|---|---|---|---|
| Open | Peterson David S | $270,000 | |
| Previous Owner | Javurek Robert | $129,000 |
Source: Public Records
Tax History Compared to Growth
Tax History
| Year | Tax Paid | Tax Assessment Tax Assessment Total Assessment is a certain percentage of the fair market value that is determined by local assessors to be the total taxable value of land and additions on the property. | Land | Improvement |
|---|---|---|---|---|
| 2024 | $9,277 | $2,730 | $190 | $2,540 |
| 2023 | $8,141 | $2,730 | $190 | $2,540 |
| 2022 | $3,024 | $2,730 | $190 | $2,540 |
| 2021 | $3,024 | $2,730 | $190 | $2,540 |
| 2020 | $3,267 | $1,410 | $190 | $1,220 |
| 2019 | $4,271 | $0 | $0 | $0 |
| 2018 | $2,953 | $1,410 | $190 | $1,220 |
| 2017 | $2,953 | $1,410 | $190 | $1,220 |
| 2016 | $2,987 | $1,410 | $190 | $1,220 |
| 2015 | -- | $1,410 | $190 | $1,220 |
| 2014 | -- | $1,410 | $190 | $1,220 |
Source: Public Records
Map
Nearby Homes